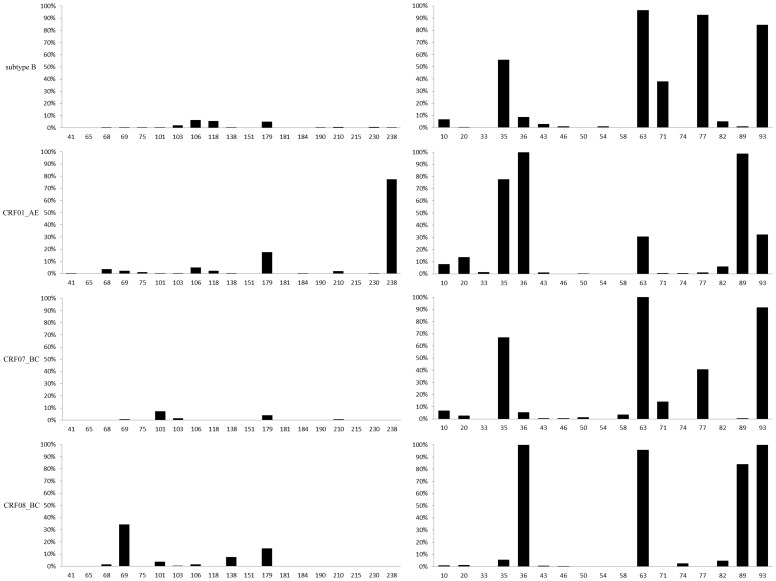
Figure 3. Subtype-specific drug resistance mutation sites analysis based on ART sensitive sequences.
Note: left part based on RT region and right part based on protease region, horizontal numbers indicate drug resistance mutation sites with significant difference among subtypes(chi-square or fisher's exact test, p<0.05), vertical percentage indicate the proportion of mutated amino acids differ from the subtype B consensus sequence.

