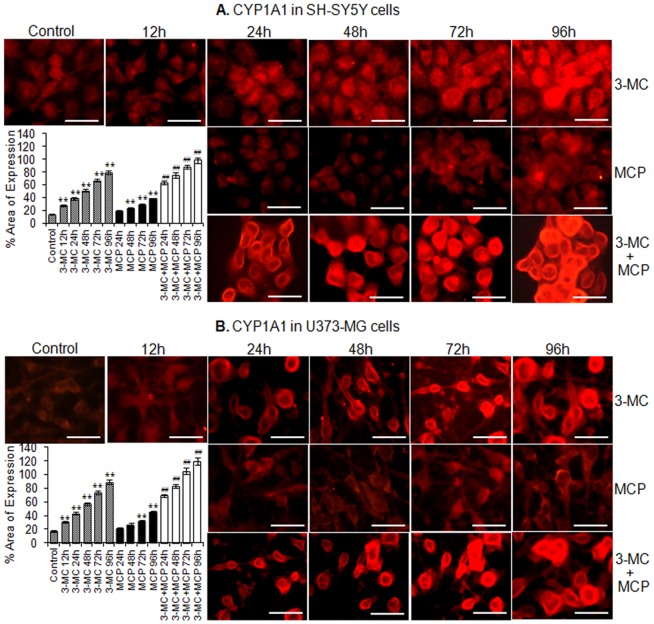
Figure 5. Immunocytochemical localization for relative quantification of xenobiotics induced alteration in protein expression of CYP1A1 in SH-SY5Y and U373-MG cells.
Changes in % area of expression of CYP1A1 protein in SH-SY5Y cells (A) and U373-MG cells (B) following the exposure of 3-MC (12–96 h), MCP (24–96 h) and 3-MC (12 h) then MCP (24–96 h) groups. Data are expressed in mean ± SE of percent area of expression in the snapped microscopic fields. A minimum of 20 microscopic fields were snapped for each group. ** = p<0.01 in comparison to respective unexposed controls; while, ## = p<0.01 in comparison to 3-MC (12 h) exposure respectively. Bar indicated in figures = 50 µm.

