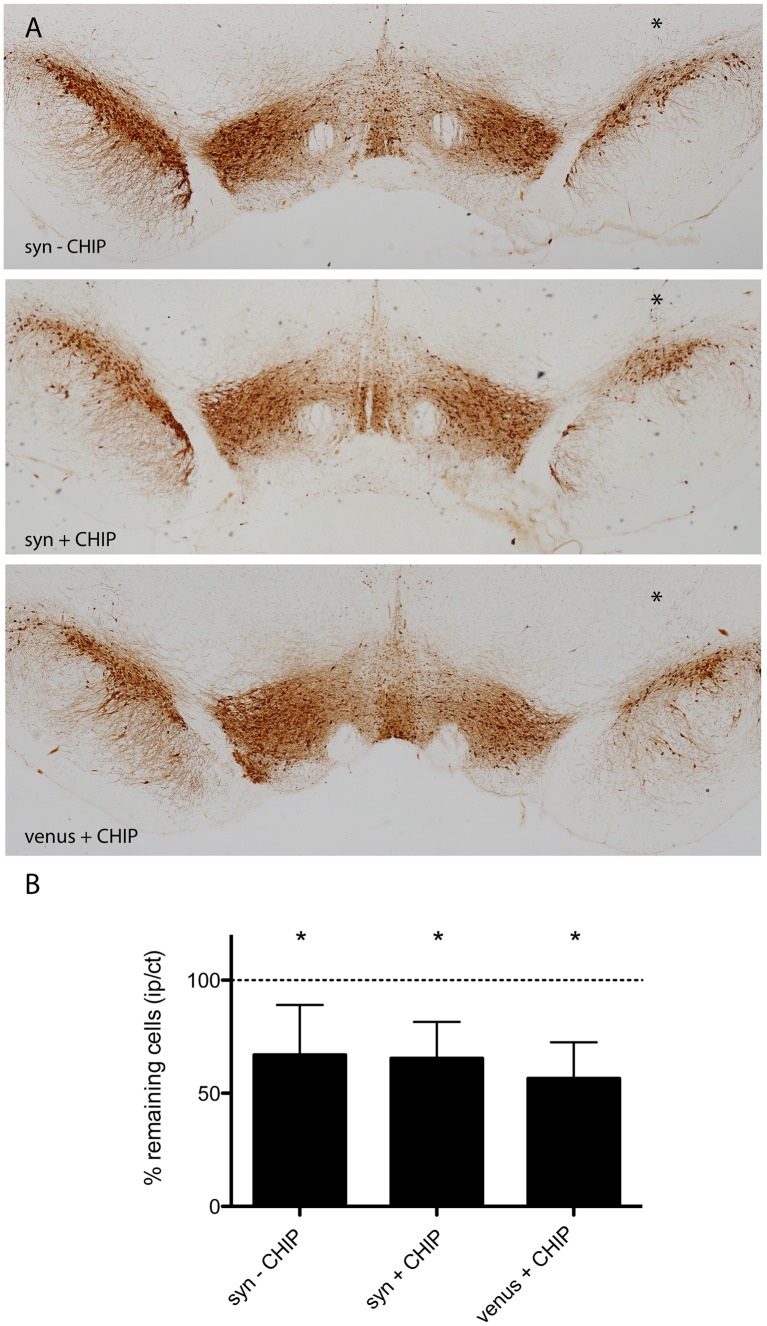
Figure 3. TH cell loss in the presence of CHIP.
Unbiased blinded stereological analysis of TH immunopositive cells in coronal sections across the SNpc was performed using DAB (A). Cell loss is determined by the ratio of TH positive cells ipsilateral (right, asterisk) to contralateral (left). A 34% lesion and a 35% lesion were measured in the syn–CHIP group (n = 10, p<0.005) and syn+CHIP group (n = 7, p<0.005) respectively (B). The venus+CHIP group expressing only venusYFP and CHIP had a 44% lesion (n = 4, p<0.05). Representative images are displayed. Scale bar 500 µm.

