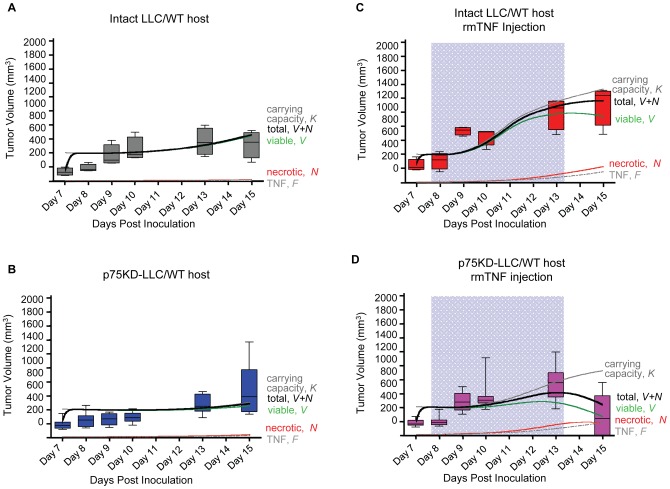
Figure 5. Numerical simulation results of the mathematical model.
Total tumor populations (black solid curves) made up of viable tumor cells (V, green) and necrotic cells (N, red) quickly approach vascular carrying capacity (K, grey) and continue to growth after carrying capacity increase through host angiogenic response to necrosis-secreted TNF (F, grey dot-dashed). (A) Slowly emerging necrotic cells secrete TNF (F, grey dot-dashed) that stimulates transient angiogenesis through host cells and p75-competent cancer cells. Intact LLC tumor volume closely follows the increasing carrying capacity. Final necrotic tumor fraction is ∼2%. Experimentally measured tumor volumes (grey box plots) shown for model validation. (B) p75KD-LLC tumor growth dynamic mimic intact LLC growth. Smaller tumor growth due to impaired pro-angiogenic signaling through p75. Final necrotic tumor fraction is ∼7%. Experimentally measured tumor volumes (blue box plots) shown for model validation. (C) Carrying capacity transiently increases through injection of rmTNF (F, grey dot-dashed, in blue highlighted time interval) initially stimulating tumor growth. Increase in necrotic mass limits tumor growth to below carrying capacity. Final necrotic tumor fraction is ∼19%. Experimentally measured tumor volumes (red box plots) shown for model validation. (D) Carrying capacity transiently increases through injection of rmTNF (F, grey dot-dashed, in blue highlighted time interval) initially stimulating p75KD/LLC+rmTNF tumor growth and later dwarfing tumor growth through TNF-induced cell death and increasing necrosis. Final necrotic tumor fraction is ∼39%. Experimentally measured tumor volumes (magenta box plots) shown for model validation. Model parameters: α = 10, β = 0.06, γ = 0.02, ζ = 0.5, δ = 6.2, ηh = 6, ηc = 0.025 (ηc = 0 for p75KD/LLC+rmTNF), θ = 0.24, ε = 6 (ε = 0 on non-treatment days), ω = 0.003, φ = 0.02.

