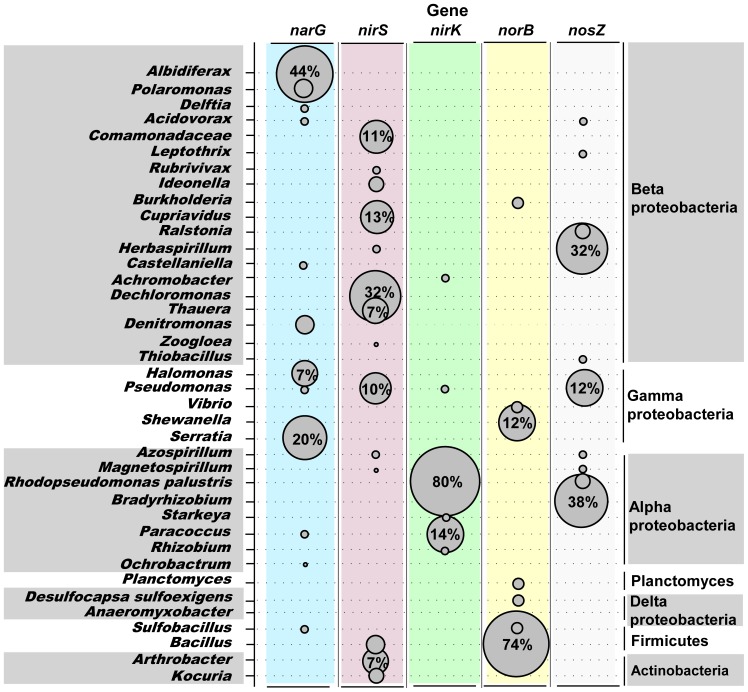
Figure 5. Relative abundance of different denitrifying genes at the genus (or species) level in Dongzhen Reservoir.
Shown are OTUs assigned to the highest taxonomic level possible using a BLASTN in GenBank database. The circle size corresponds to the relative average abundance OTUs for each denitrifying gene.

