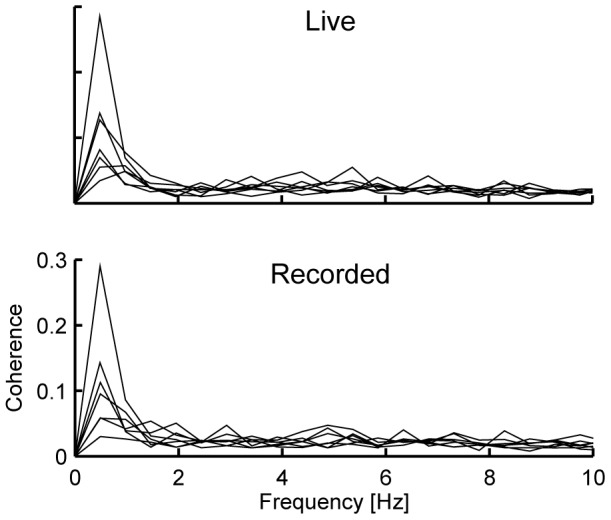
Figure 1. Individual coherence spectra in ASD subjects.

Individual coherence spectra obtained in each condition for the right-hemisphere MEG sensor showing the maximum coherence level. Significant coherence at 0.5 Hz was observed in all ASD subjects in Live and in 6 out of 7 subjects in Recorded. Y–axis values are identical on both plots.
