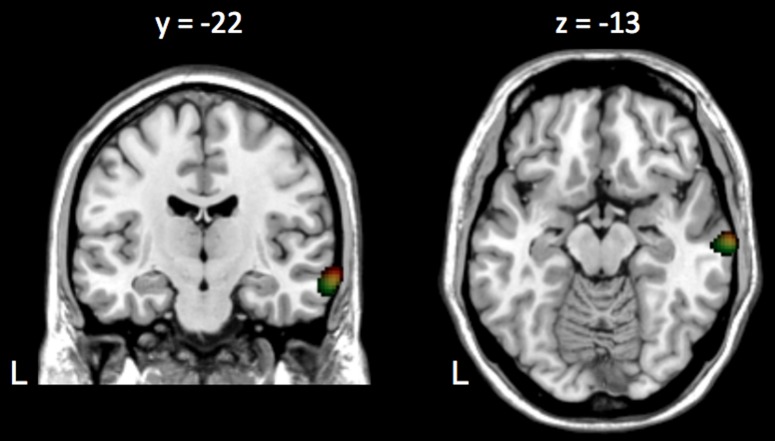
Figure 2. Group-level coherence maps in ASD subjects.
Group level coherence maps computed at 0.5(Live, red; Recorded, green; intersection between Live and Recorded, yellow). In Live, the maximum coherence occured at the right superior temporal sulcus and in Recorded, at the upper bank of the middle temporal gyrus. Coherence maps were thresholded at the maximum of coherence to isolate the local coherence maxima (Live, coherence threshold: 0.64–0.71; Recorded, coherence threshold: 0.60–0.67).

