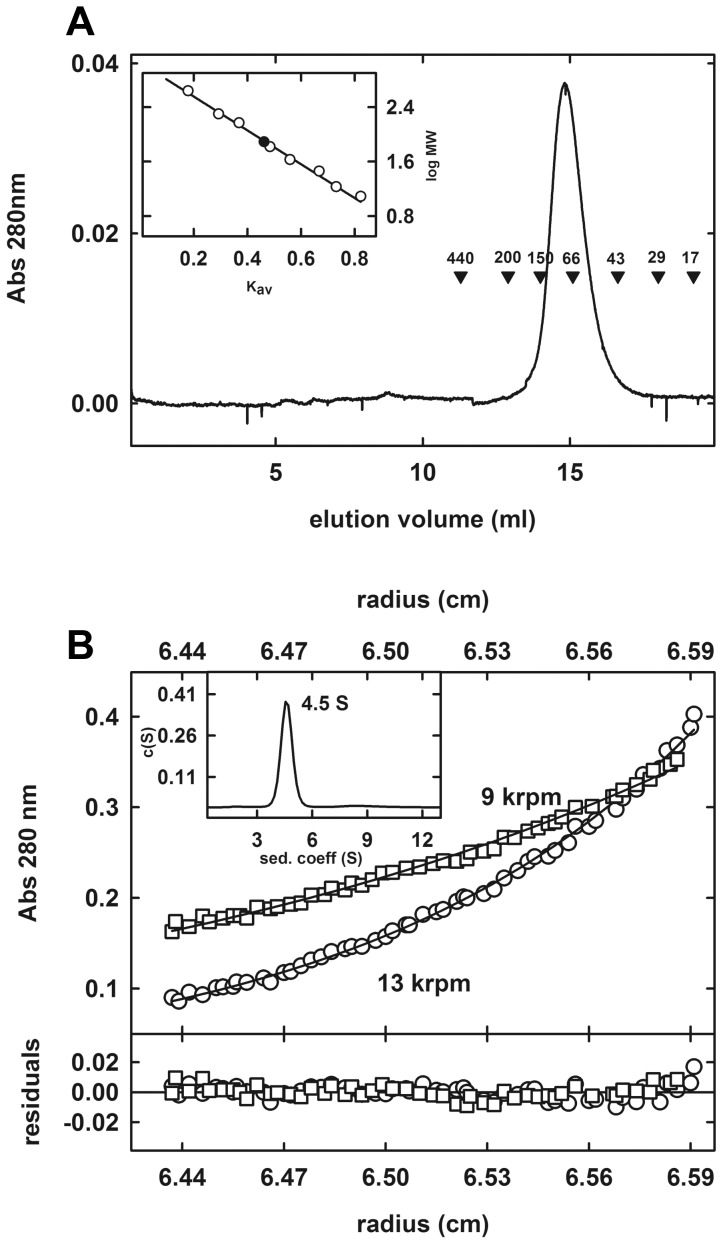
Figure 5. Analysis of the oligomeric state of LpEst1 in solution.
(A) Analytical gel-filtration of LpEst1 on Superdex 200 10/300 GL Tricorn column. The elution profile of LpEst1 is shown together with the elution positions for some standard proteins (molecular mass in kDa). Inset, semilog plot of the molecular mass of all standards used versus their Kav values (open circles). The closed circle indicates the position of the Kav value of LpEst1 interpolated in the regression line (solid line) (B) Analytical ultracentrifugation analysis of LpEst1. Sedimentation equilibrium analysis of LpEst1 (10 μM) in Tris buffer (20 mM Tris-HCl, pH 8.0, and 0.1 M NaCl) at 9,000 rpm (open squares) and 13,000 (open circles). Absorbance at 280 nm is plotted against the radial position from the center of the rotor. The fit to the data set (solid line curves) corresponds to an ideal species with a molecular mass of 77.2±4.2 kDa (n = 3). Residuals from this fit are shown in the panel at the bottom. Calculations were done with the program Heteroanalysis [47]. Inset, sedimentation coefficient c(s) distributions for LpEst1 (10 μM) in Tris buffer (20 mM Tris-HCl, pH 8.0 with 0.1 M NaCl). Raw sedimentation velocity profiles for this analysis were acquired using absorbance at 280 nm, 45,000 rpm, 20 °C, and different times (not shown). Calculations were done with the program Sedfit [46].

