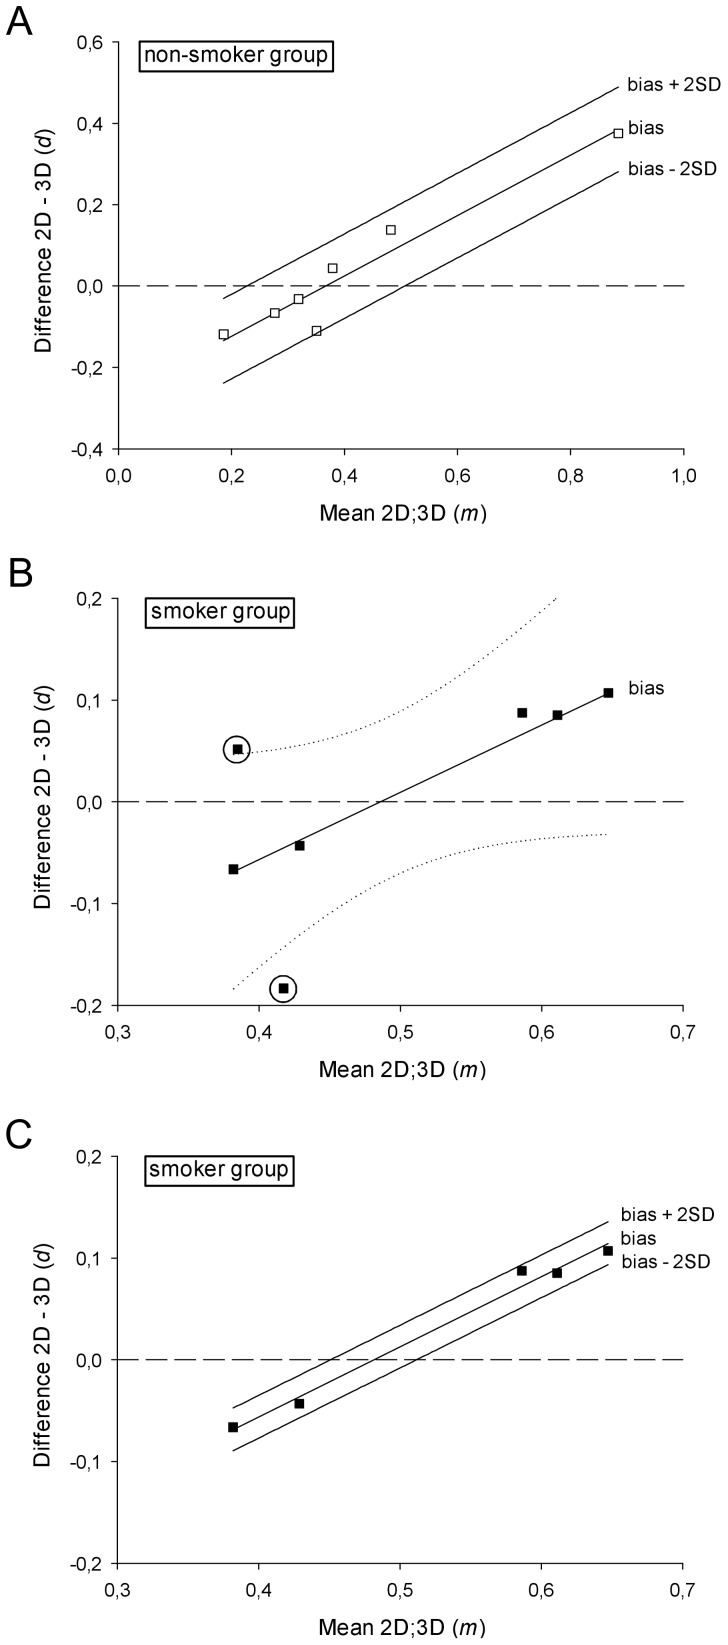
Figure 7. A clear correlation between the difference and the mean magnitude can be noticed for both groups.
Dashed line y = 0 represents the line of equality, which stands for perfect agreement. (a) Regression based mean difference (bias) and 95% limits of agreement for the differences of the CD68+/CD3+ cell density ratios as determined by the 2D nucleus and 3D approaches in the non-smoker group. All values lie within the interval between the calculated 95% limits of agreement; (b) Regression based mean difference (bias) with 95% C.I. of the regression line (dotted) for the differences of the CD68+/CD3+ cell density ratios in the smoker group. The 95% C.I. includes several horizontal lines (slope = 0) so that the fitted linear model does not achieve the desired statistical significance. Two large outliers encircled; (c) Regression based mean difference (bias) and 95% limits of agreement for the differences of the CD68+/CD3+ cell density ratios as determined by the 2D nucleus and 3D approaches in the smoker group after removing the two large outliers. All values lie within the interval between the calculated 95% limits of agreement. Notice the similar slope to the fitted model in Figure 7a (non-smoker group).

