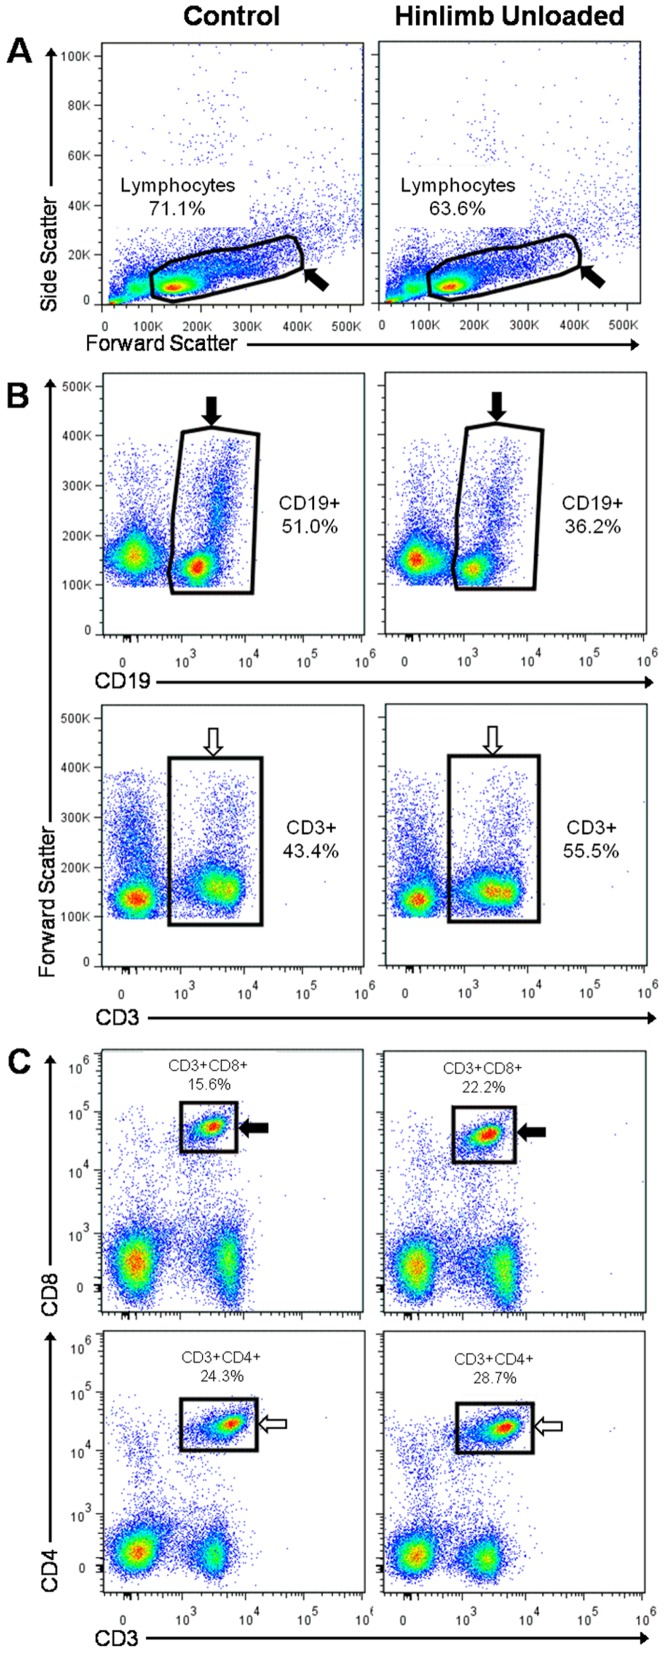
Figure 3. Representative flow cytometry density plots from splenic lymphocyte populations.
Splenocytes were isolated from mice and labeled as described in the Methods section. For each mouse, the lymphocyte populations were determined as in the two examples presented here. (A) Splenocyte analysis by flow cytometry using FlowJo software and sorted with FSC/SSC profiles, separating viable lymphocytes (black arrow) from the other cells. (B) Among the lymphocyte population, CD19+ B cells (black arrow) were selected in the FSC/CD19 window and CD3+ T cells (white arrow) were selected in the FSC/CD3 window. (C) Among the lymphocyte population, CD3+CD8+ T cells (black arrow) were selected in CD3/CD8 profiles and CD3+CD4+ T cells (white arrow) were selected in CD3/CD4 profiles.

