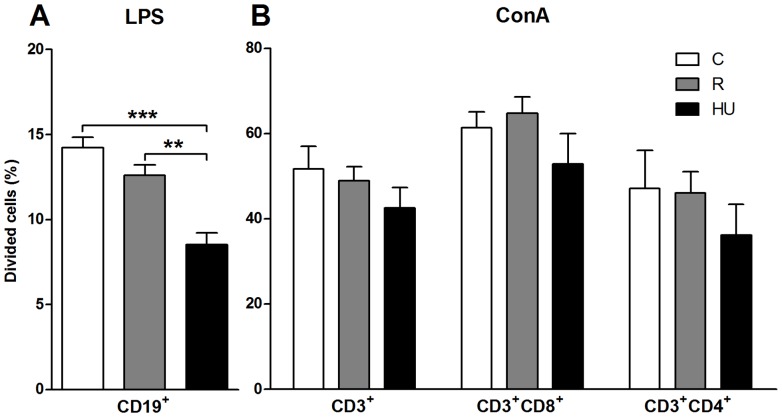
Figure 7. Percentages of dividing lymphocytes 72 hours after mitogenic stimulation.
In vitro culture of splenocytes stained with CFSE allowed the analysis of B, Tc and Th divisions in response to a mitogenic stimulation. Subpopulations of lymphocytes were determined within the lymphocyte gate. Within each subpopulation, CFSE fluorescence was analyzed by flow cytometry. Then, the FlowJo software automatically determined generation 0 and calculated the percentage of dividing cells from the intensity of residual CFSE in cells. Each group was compared to the others. n = 5 mice per group. Differences were found to be statistically significant using an ANOVA and Tukey post-hoc test. ** p<0.005; *** p<0.001. (A) Percentages of dividing CD19+ B cells in response to LPS. Dividing B cells were significantly decreased in the hindlimb unloaded (HU) group compared to the restrained (R) and control (C) groups (by 33% and 40%, respectively). (B) Percentages of dividing CD3+ T cells, CD3+CD8+ Tc cells and CD3+CD4+ Th cells in response to ConA. No significant difference was obtained for dividing T cells despite the decreases observed for the HU group compared to C mice.

