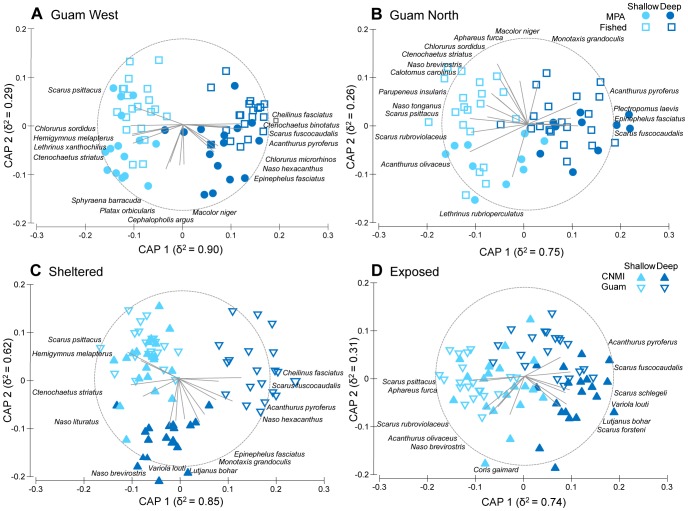
Figure 5. Canonical analysis of principal components (CAP) ordinations.
Differences in assemblage structure of fished species biomass between MPA status and depth at each Guam location (A, B) and between jurisdiction and depth at each level of exposure (C, D). Species correlations with the canonical axis are indicated by the length and direction of vectors.

