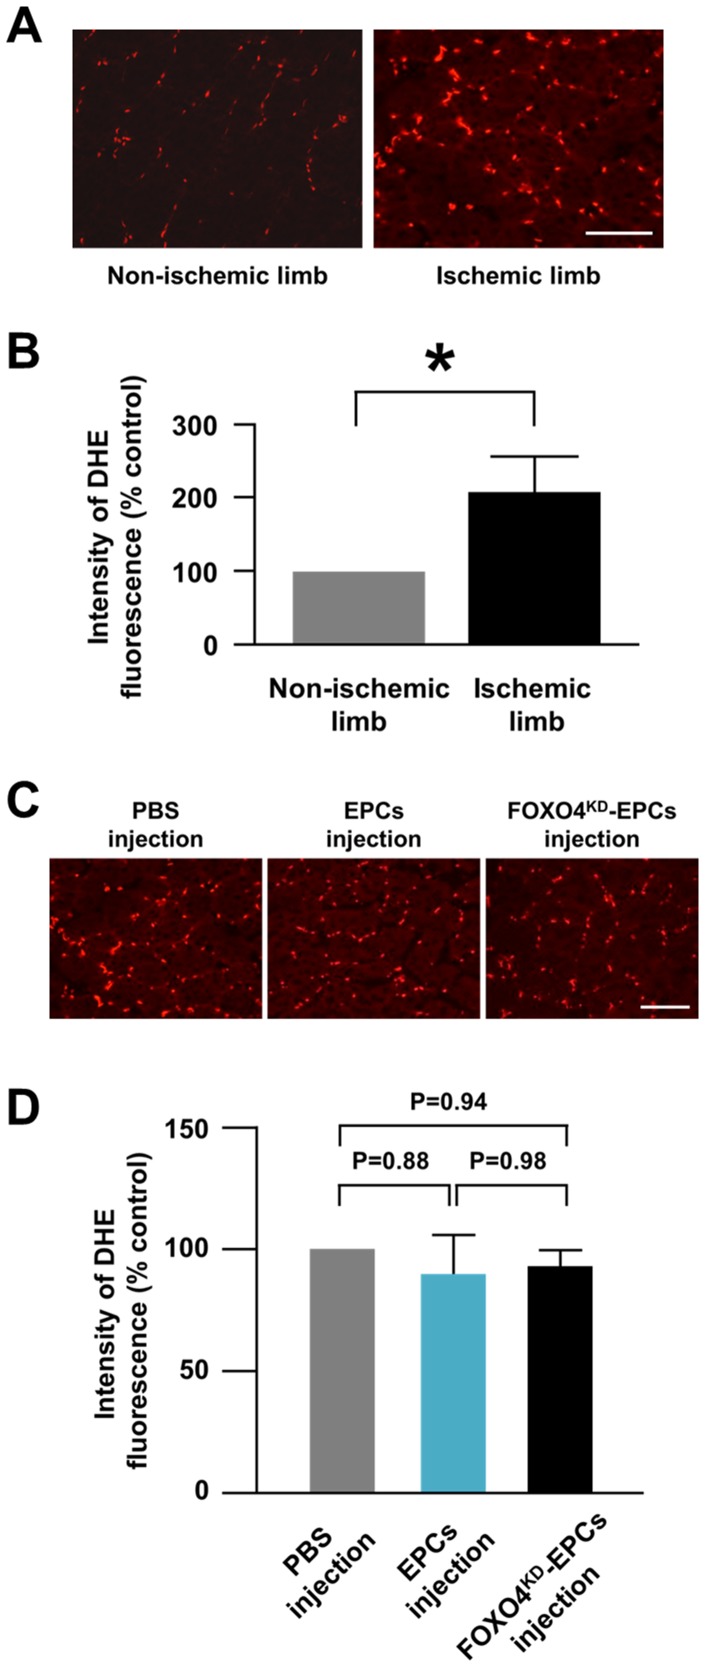
Figure 7. ROS production in athymic nude rat ischemic limbs.
(A) Representative fluorescence microscopic images of DHE-stained tissues of the non-ischemic and ischemic limbs of athymic nude rats. DHE was stained red. Scale bar: 100 μm. (B) Pooled data of DHE fluorescence intensity of the rat non-ischemic and ischemic limbs (*: p<0.05; n = 12, each). (C) Representative fluorescence microscopic images of DHE-stained tissues of the ischemic limbs 24 h after intramuscular injection of PBS, EPCs, or FOXO4KD-EPCs. Scale bar: 100 μm. (D) Pooled data of DHE fluorescence intensity of the ischemic limbs 24 h after intramuscular injection of PBS, EPCs, or FOXO4KD-EPCs (n = 7, each).

