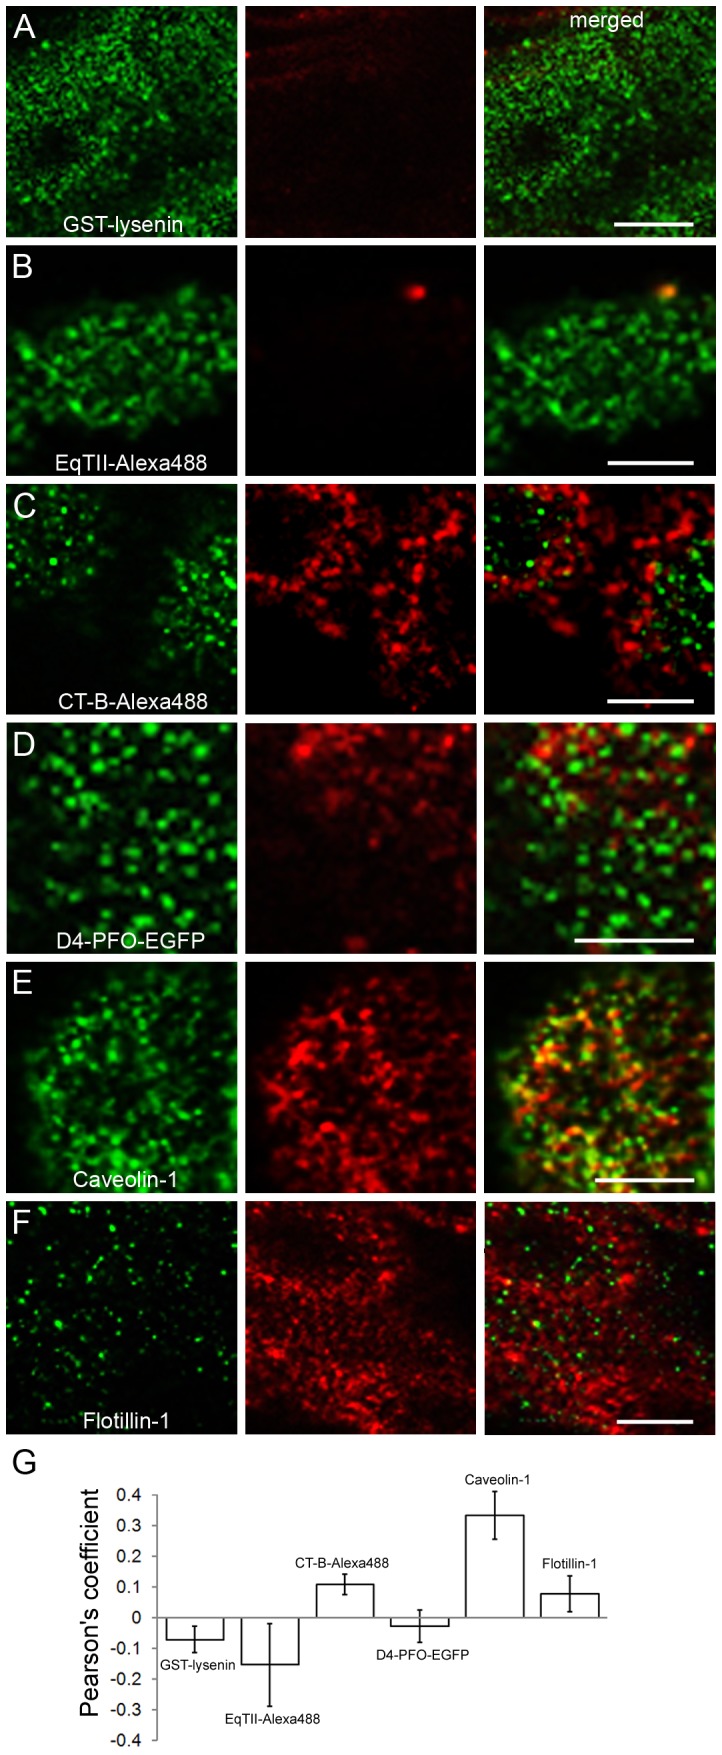
Figure 8. Co-localisation of OlyA-mCherry and other membrane markers.

(A–F) Representative images of co-localisation between OlyA-mCherry (red) and other membrane markers (green), as indicated. Scale bar, 5 μm. (G) Quantitative analysis of the co-localisation between OlyA-mCherry and the other membrane markers. Pearson's correlation coefficients were calculated using the JACoP plugin (Image J programme) from optical sections. The degree of co-localisation from the Pearson's value correlation coefficients s were categorised as very strong (0.85 to 1.0), strong (0.49 to 0.84), moderate (0.2 to 0.48), weak/moderate (0.1 to 0.2), weak (−0.26 to 0.09), and very weak (−1 to −0.27). Error bars are the standard errors of the means (n = 5).
