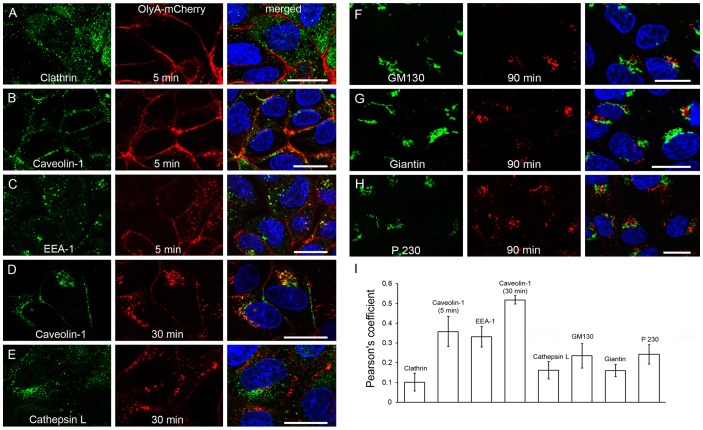
Figure 9. Internalisation of OlyA-mCherry in MDCK cells.
(A–H) Representative fluorescent images of MDCK cells (blue, DAPI; red, OlyA-mCherry) showing immunolabelling of respective membrane domains (green, as indicated) and labelling of OlyA-mCherry (1 μM). After 5 min, OlyA-mCherry shows “weak/moderate” co-localisation with clathrin on the plasma membrane (A), and “moderate” with caveolin-1 (B) and EEA-1 (C). After 30 min, OlyA-mCherry shows “strong” co-localisation with caveolin-1 (D) and “weak/moderate” with cathepsin L (E). After 90 min, OlyA-mCherry shows “moderate” co-localisation with the GM130 (F) and P230 (H) markers of the Golgi apparatus, and “weak/moderate” for giantin (G). (I) Quantitative analysis of the co-localisation between OlyA-mCherry and the other membrane markers. Co-localisation in (F–H) are restricted to individual spots. Scale bars: 20 μm.

