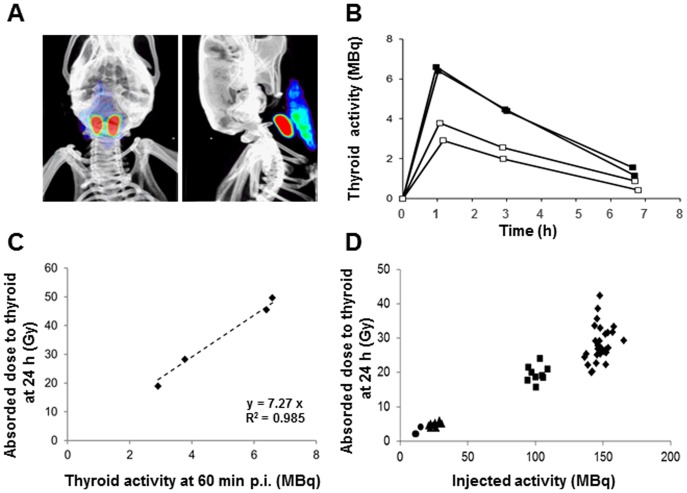
Figure 1. 99mTcO4 −-SPECT/CT imaging and absorbed dose to the thyroid.
(A) Volume-rendered, fused SPECT/CT images in anterior and lateral views demonstrating the thyroid lobes (red) and the salivary glands (blue-green), 60 minutes after 99mTcO4 − administration. (B) Kinetics of 99mTcO4 − activity in the thyroids of four Balb/c mice fed with a normal iodide diet (open squares) or with a low iodide diet (filled squares), obtained upon injection of 150 MBq of 99mTcO4 −. The values presented are not corrected for decay. (C) Correspondence between thyroid activity (MBq) at 60 minutes post injection and absorbed dose to the thyroid (Gy) at 24 hours. (D) Absorbed dose to the thyroid at 24 hours in mice injected with 10 MBq (circles, n = 4), 25 MBq (triangles, n = 9), 100 MBq (squares, n = 9) or 150 MBq (diamonds, n = 29) 99mTcO4 −.

