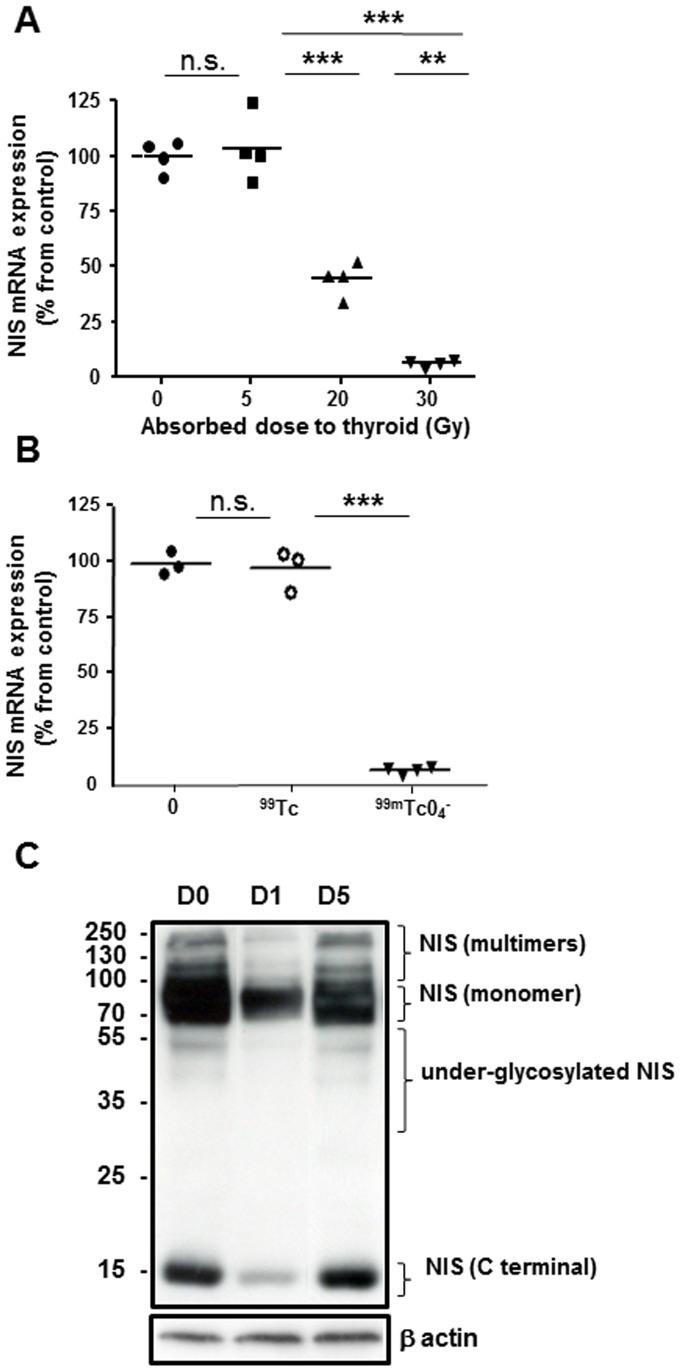
Figure 4. Expression of NIS mRNA and protein in thyroids of mice 2499mTcO4 −.
(A) Quantitative RT-PCR analyses of NIS expression in control thyroids or thyroids exposed to 5 Gy, 20 Gy or 30 Gy. The means (n = 4 mice/group) are presented (horizontal bars) as well as each individual point. (**: p<0.01; ***: p<0.001). (B) Quantitative RT-PCR analyses of NIS expression in control thyroids or thyroids exposed to decayed 99mTcO4 − (99Tc on the figure) or 30 Gy of 99mTcO4 − (99mTcO4 − on the figure). The means (n = 3 to 4 mice/group) are presented (horizontal bars) as well as each individual point. (C) Western blot analyses of NIS expression levels assessed on membrane preparations from thyroids of control mice or from thyroids extracted 1 and 5 days after exposure to 30 Gy 99mTcO4 −. The immunoblot shown is representative of three independent experiments.

