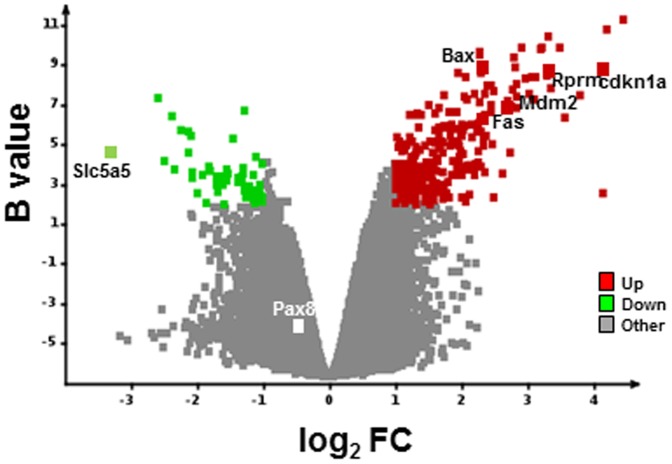
Figure 7. Global pattern of gene expression in thyroids of 99mTcO4 −-exposed versus control mice.
RNA samples from thyroids of control or 99mTcO4 −-exposed mice were harvested (n = 4 per group) 24 hours after radioisotope or saline administration and expression profiles were determined with Agilent arrays. Volcano plot showing the distribution of differentially expressed transcripts between 99mTcO4 −-exposed versus control thyroids. Log(base2) of the fold-change (LogFC) is plotted against the B-statistic value for each transcript. Several transcripts – NIS/Slc5a5, Pax8, and a subset of p53-regulated genes (p21/cdkn1a, Rprm, Bax, Mdm2, Fas) – are highlighted. Significantly down- and upregulated genes are shown in green and red, respectively.

