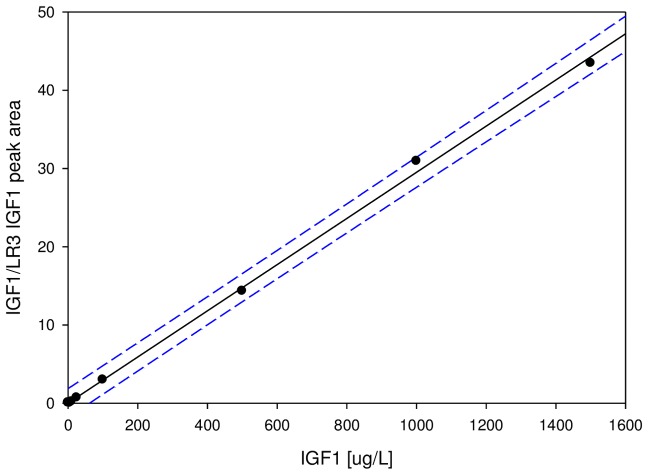
Figure 2. An example of a standard curve for the IGF1 MSIA.
Plotted are the peak area ratios of IGF1/LR3-IGF1 over the standards concentrations. Solid line: linear fit with R2 = 0.99, SEE = 0.69. Dotted lines: 95% prediction intervals. The average r2 for the twelve standard curves was 0.98 and the range was 0.97–0.99.

