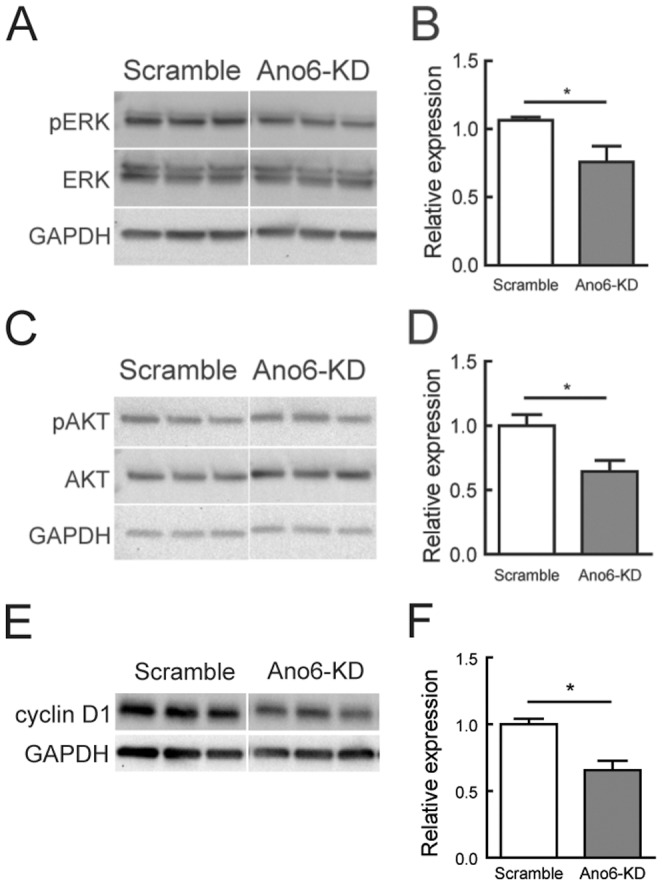
Figure 3. Altered ERK/AKT signaling in Ano6-KD C2C12 myoblasts.

(A) Western blotting analysis of ERK phosphorylation (pERK) and total ERK expression (ERK) in C2C12 myoblasts of different stable lines. Three independent experiments per cell line were loaded on the gel. (B) Normalized expression levels of ERK phosphorylation and total ERK by membrane densitometry. (C) Western blotting analysis of AKT phosphorylation (pAKT) and total AKT expression (AKT) in C2C12 myoblasts of different stable lines. Three independent experiments per cell line were loaded on the gel. (D) Normalized expression levels of AKT phosphorylation and total AKT by membrane densitometry. (E) Western blotting analysis of cyclin D1 in C2C12 myoblasts of different stable lines. (F) Normalized expression levels of cyclin D1 by membrane densitometry. Three independent experiments per cell line were loaded on the gel. GAPDH was used as a loading control. *p<0.05.
