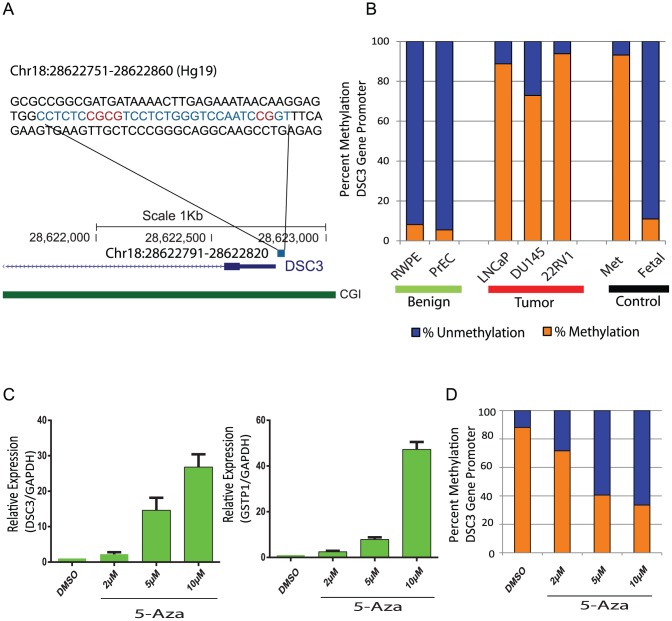
Figure 3. Hypermethylation of DSC3 Promoter in PCa Cell Lines.
(A) Sequence of the DSC3 promoter (Chr18:28622751-28622860) and the region analyzed by pyrosequencing are given in blue (Chr18:28622791-28622820) and the CG positions monitored within are indicated in red. CGI, CpG island. (B) Bar plot depicts the average of the percent methylation in the three CG positions in prostate cell lines. Blue-percent unmethylation; Orange-percent methylation; Bi-sulfite converted universally methylated gDNA and fetal DNA were used as positive and negative controls respectively. (C) DSC3 expression as assessed by Q-PCR in LNCaP cells treated with 5-Aza-deoxycytidine (5-Aza), GSTP1 was included as a positive control. (D) Bar plot depicts the average of the percent methylation in the three CG positions in LNCaP treated with 5-Aza.

