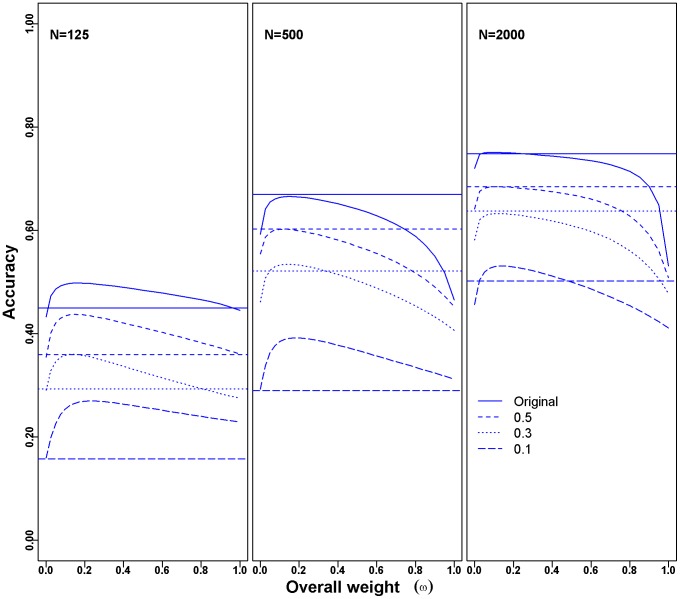
Figure 2. Accuracy of WGP for simulated traits with different heritabilities and sample sizes.
The curves show the change of the accuracy obtained with BLUP|GA for varying overall weight ω for milk yield. Different curves represent the accuracies obtained from traits with original phenotype (solid line), or simulated phenotypes with heritability of 0.5 (short-dashed line), 0.3 (point line) and 0.1 (long-dashed line), respectively. The numbers of QTL counts were used to infer the marker weights for the BLUP|GA approach. The GBLUP approach corresponds to scenarios in which ω = 0 (starting points for each curve), and the accuracies of BayesB are presented by horizontal lines. Accuracies were calculated as the mean of 20 replicates of five-fold cross-validation with different population sizes (N = 125, 500, and 2000).

