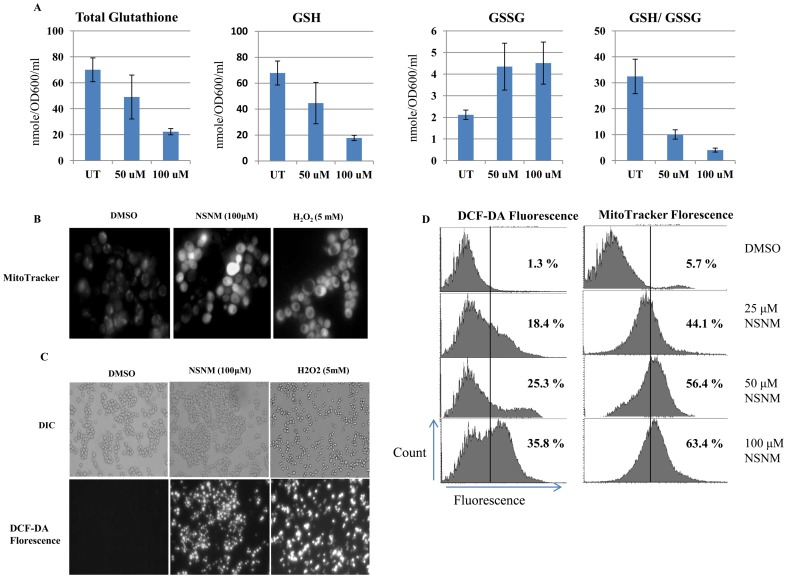
Figure 4. NSNM causes depletion in total glutathione levels and increase intracellular ROS levels.
(A) Wild type cells were grown in DMSO or indicated concentration of NSNM for 3 h. GSH, GSSG, and the GSH: GSSG ratios were determined. Values are means S.D. of three independent cultures. (B & C) Mitochondrial membrane permebility and reactive oxygen species (ROS) production detected by MitoTracker and DCF-DA respectively in control cells and cells treated with 50 or 100 μM of NSNM for 3 h. Cells treated with 5 mM H2O2 served as positive control. Upper panel of (C) shows phase contrast microscopic images; the lower panel show florescence microscopic image of the same cells. (D) Wild-type yeast strain grown in SC media and treated with increasing concentration of NSNM (25, 50 or 100 μM) for 1 3 h. Yeast cells were processed for FACS analysis after staining with either DCF-DA or MitoTracker Red. % value depicts the proportion of cells showing fluorescence after staining with indicated dyes.

