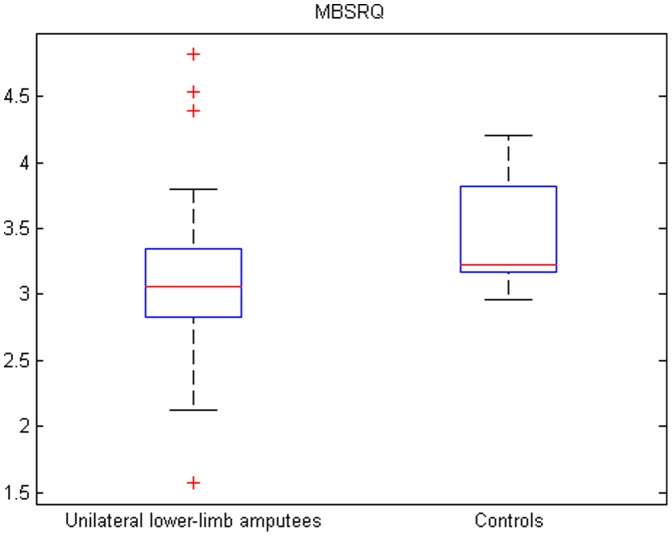
Figure 1. Results of the MBSRQ in unilateral lower-limb amputees and controls.
Box plot showing the distribution of the MBSRQ in unilateral lower-limb amputees (left) and controls (right). Horizontal red lines indicate medians; blue boxes specify inter-quartile ranges and dashed lines the ranges without outliers.

