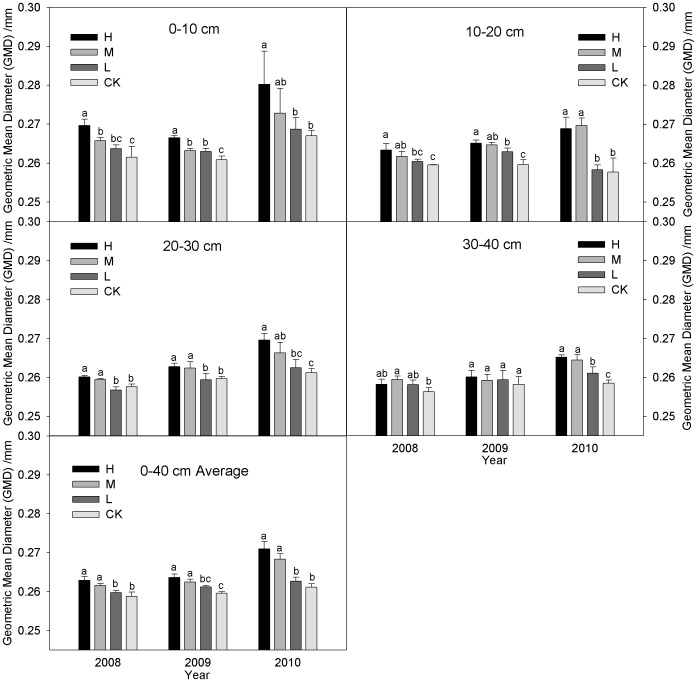
Figure 4. GMD values with wet sieving under the different straw incorporation treatments.
Note: GMD, geometric mean diameter; CK, no straw incorporation; L, incorporation of straw at a low rate of 4 500 kg ha−1 maize straw; M, incorporation of straw at a medium rate of 9 000 kg ha−1 maize straw; H, incorporation of straw at a high rate of 13 500 kg ha−1 maize straw; Average, the mean value of the 0–40 cm soil layers. Bars with different lower case letters indicate significant differences at P<0.05.

