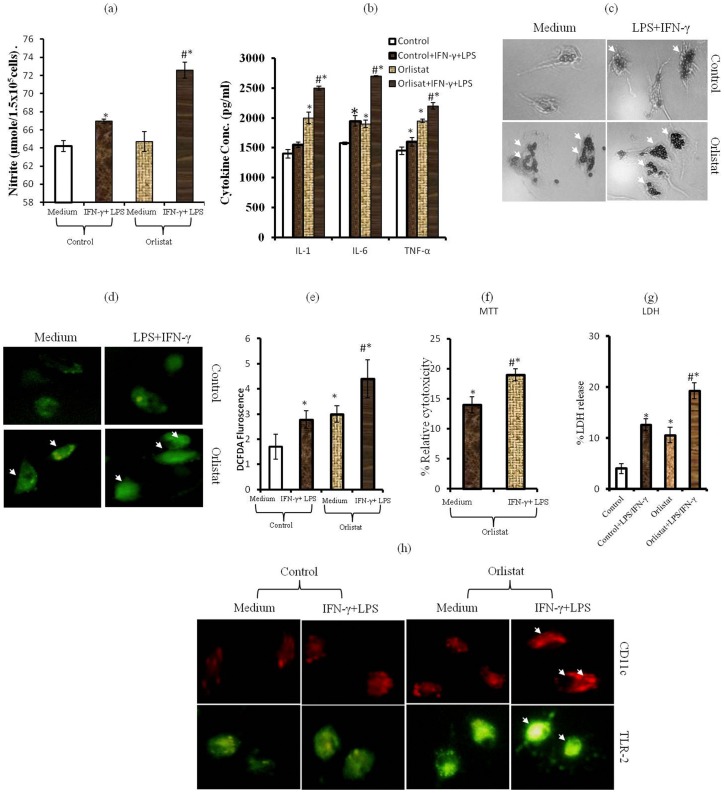
Figure 6. BMDM obtained from BMC of orlistat-administered groups display M1 Mφ phenotype.
BMDM differentiated from BMC of control or orlistat-administered tumor-bearing mice were incubated in vitro for 24h in medium alone or containing IFN- γ (100IU/ml) + LPS (10ng/ml) followed by estimation of NO (a), indicated cytokines by ELISA in culture supernatant (b), assay of ROS expression (d,e), phagocytosis (c), BMDM-mediated tumoricidal activity (f,g) and expression of cell surface functional markers: CD11c and TLR2 (h). Values shown in (a,b,e,f,g) mean ± SD of three independent experiments done in triplicate.*p<0.05 vs. values of respective control. *#p<0.05 vs. values for orlistat and LPS + IFN-γ treated control groups. Arrows indicates increased phagocytosis (c), expression of ROS (d) and CD11c & TLR-2 (h) in BMDM of orlistat group treated with IFN-γ + LPS.

