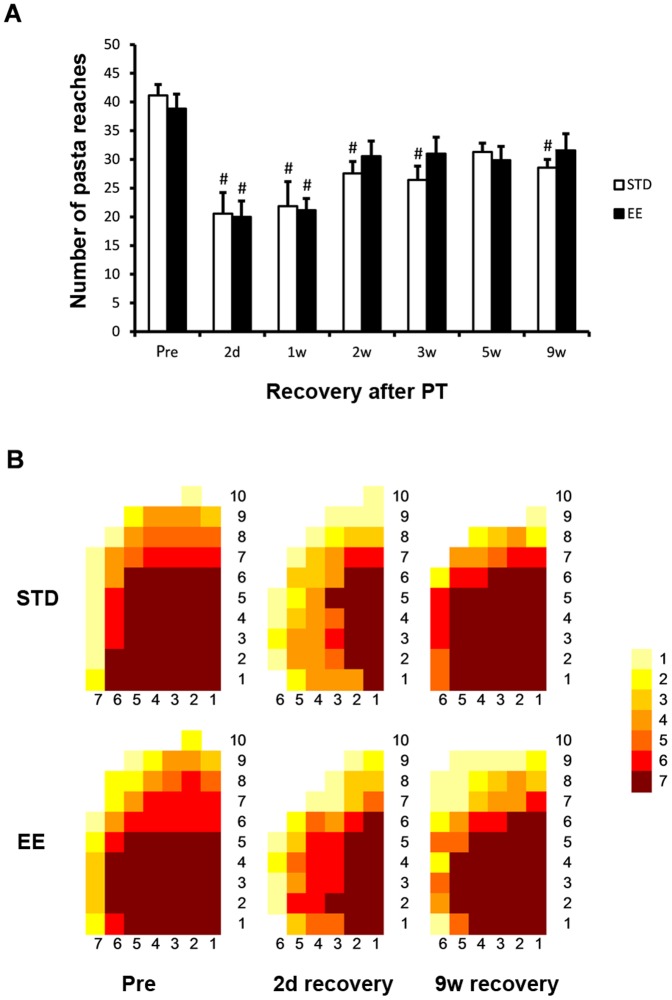
Figure 3. Skilled reaching test.
Skilled reaching test at different times of recovery after PT stroke for animals housed in standard (STD) and enriched environment (EE). (A) The total number of pasta pieces reached during 20 minutes prior to PT (pre) and at different time points after PT. (#: p<0.05 when compared to the respective group before stroke (pre). (B) Map of the reaching area presenting the number of animals (as indicated by colors) that reached the pasta pieces (n = 7 for each housing condition).

