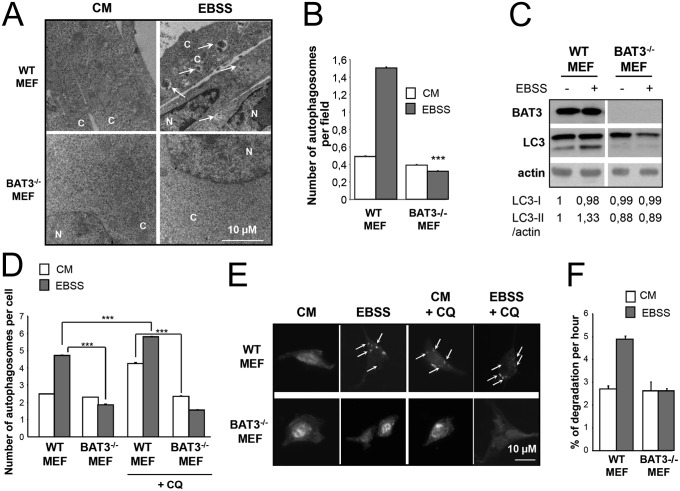
Fig. 2.
BAT3 is essential for autophagy in MEFs. (A) Representative ultrastructural images of WT and BAT3−/− MEFs in CM or EBSS for 2 h. Arrows indicate autophagosomes. C, cytosol; N, nucleus. (B) Quantification of the number of autophagosomes per field as shown in A. ***P ≤ 0.001 vs. WT MEFs in EBSS. (C) WT and BAT3−/− MEFs were cultured in CM (−) or EBSS for 2 h (+), then immunoblotted as indicated. Densitometric analysis of the LC3-I and LC3-II /actin ratio was arbitrarily set at 1 for WT MEFs in CM and represents the mean (SD) of five independent experiments. (D and E) Quantification of the autophagosomes per cell (D) and representative images (E) of cells transfected with the peGFP-LC3 plasmid and incubated in CM or EBSS for 2 h and then with or without 20 µM chloroquine (CQ) for 6 h. Results are the mean (SD) of three independent experiments. ***P ≤ 0.001. (F) Measurement of long-lived protein degradation in WT and BAT3−/− MEFs cultured in CM or EBSS for 2 h.

