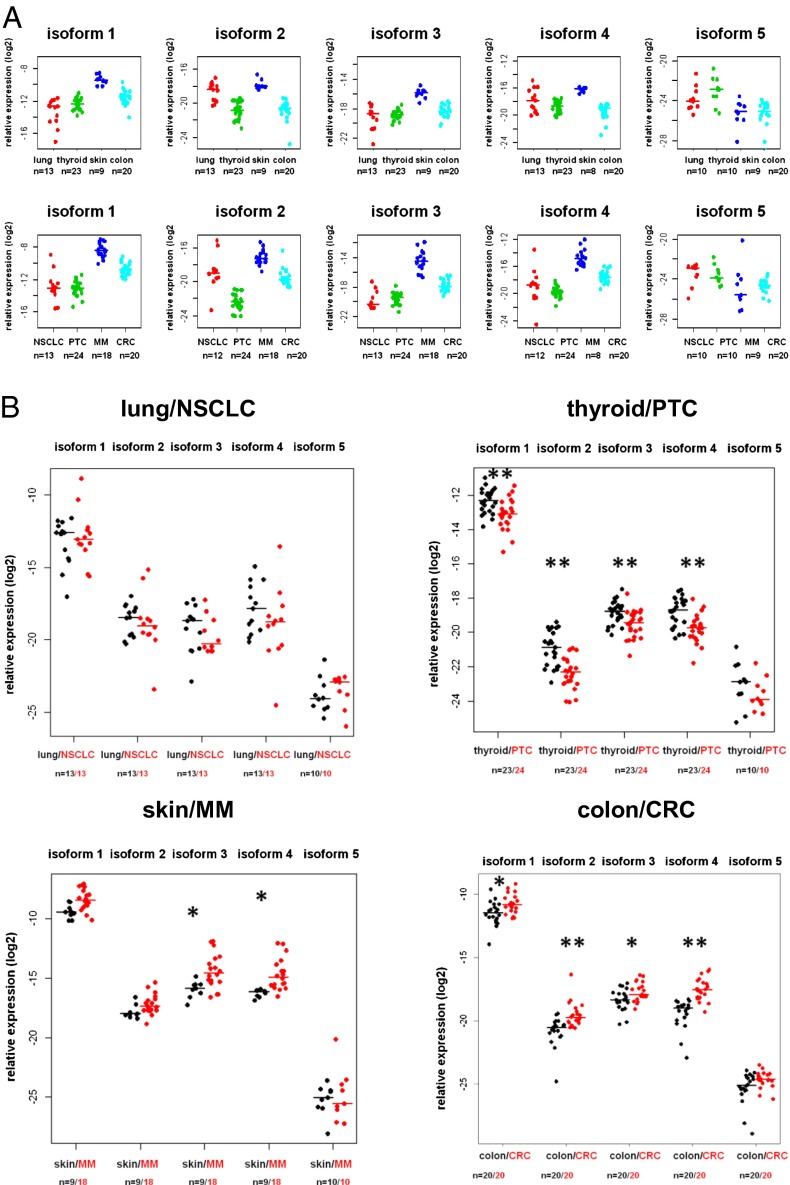
Fig. 2.
(A) Expression levels of the NRAS isoforms in four human tissues and their corresponding malignancies. (Upper) Relative expression levels of the NRAS isoforms in lung tissue, thyroid tissue, skin, and colon tissue. (Lower) Relative isoform expressions in paired tumor tissue of the patients listed above are displayed: patients with NSCLC, PTC (including one nonpaired tumor sample), MM (including nine nonpaired MM samples), and CRC. (B) Expression levels of the NRAS isoforms in four human malignancies compared with normal tissues. Displayed are the relative expression levels of the NRAS isoforms in paired tumor vs. normal tissues of lung/NSCLC, PTC (including one nonpaired sample), skin/MM (including nine nonpaired samples), and CRC. PTC, MM, and CRC differ in some of their isoform expression patterns compared with their paired normal tissues (*P < 0.05 and **P < 0.001, two-sided Wilcoxon rank-sum test for paired samples).

