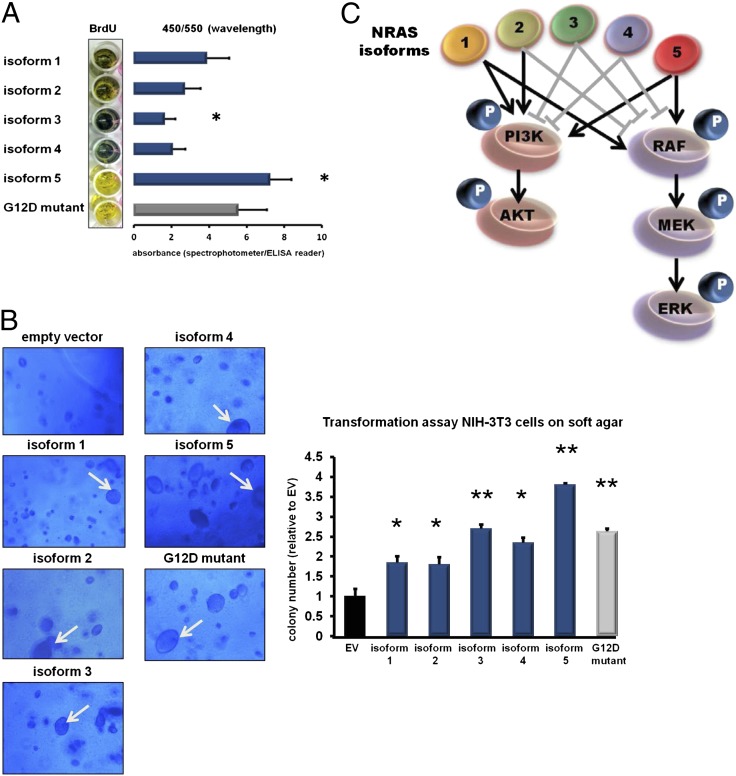
Fig. 4.
(A) Effect of the NRAS isoforms on cell proliferation. Skin fibroblasts were stably transfected with the different NRAS isoforms (blue bars) and the NRAS G12D mutant (gray bar) by using lentiviral technologies. At 72 h after infection, a photometric BrdU assay was performed to assess the proliferation rates of the fibroblasts after forced isoform expression. Color changes from blue to yellow indicate increased BrdU uptake corresponding to increased cell proliferation. Absorbances were determined by using a spectrophotometer and are indicated by bar graphs depicted next to the macroscopic plate appearance. Whereas isoform 3 decreased proliferation, isoform 5 increased proliferation compared with isoform 1. (All values are presented as mean ± SD of assays performed in triplicate; *P < 0.05 vs. isoform 1, two-tailed Student t test). (B) Transformation assay of NIH 3T3 cells on soft agar. Representative pictures of the microscopic appearance of NIH 3T3 cells on soft agar 8 d after stable infection with the NRAS isoforms (blue bars) and the NRAS G12D mutant (gray bar) are shown. Empty vector (EV; black bar) was included as a negative control. All NRAS isoforms led to the development of the typical giant cell phenotype of NIH 3T3 cells (indicated by white arrows), but with different frequencies. The bar graph displays the colony numbers analyzed by fluorimetric assays. (All values are presented as mean ± SD of assays performed in triplicate; *P < 0.05 and **P < 0.001 vs. empty vector, two-tailed Student t test). (C) Graphical summary of the different downstream effects of the NRAS isoforms. Gray block bars indicate reduction of downstream phosphorylation (marked as “P”), and black arrows indicate increased downstream phosphorylation.

