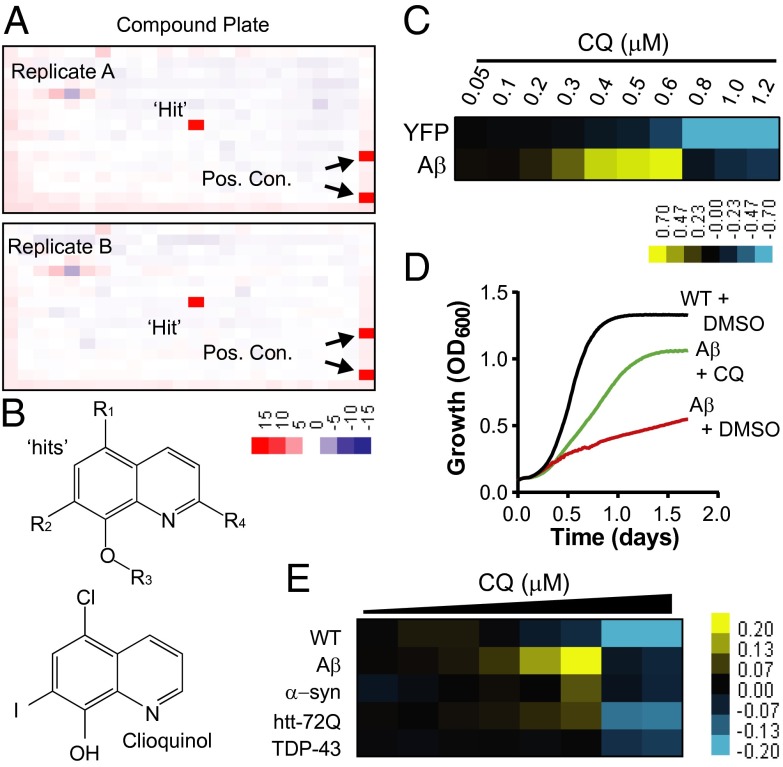
Fig. 1.
Small-molecule screen identifies 8-OHQ that protect against Aβ toxicity. (A) Representative duplicate 384-well screening plates containing a single “hit” and positive controls. Values are Z scores, where “red” indicates rescue and “blue” indicates toxicity. (B) General structures of 8-OHQ hits and CQ. (C) Dose–response heat map of CQ treatment of both YFP- and Aβ-expressing strains. Data indicate the difference in OD600 between CQ- and DMSO-treated samples. Yellow, rescue. Blue, toxicity. Concentrations are in micromolar. (D) Growth curves of WT yeast and the Aβ strain treated with the maximal effective dose of CQ or DMSO alone. The y axis is OD600, and the x axis is time in days. (E) Dose–response curves of WT and multiple proteotoxicity yeast models treated with CQ in 384-well plates. Data are reported as the difference in OD600 between the CQ-treated and DMSO-treated conditions. Yellow indicates rescue, and blue reflects toxicity. The doses of CQ range from 5 μM down to 0.3 μM CQ with a 30% dilution at each step.

