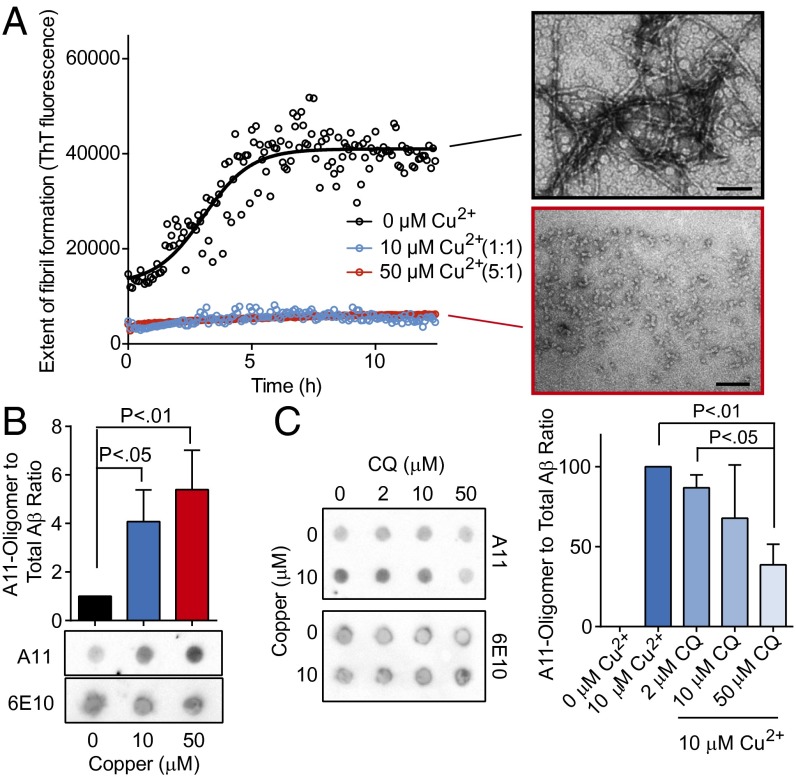
Fig. 5.
Effects of copper and CQ on Aβ oligomers. (A) ThT fluorescence of Aβ assembly reactions in the presence of copper (micromolar) at indicate molar ratios compared with Aβ. EM shows representative fields of Aβ with no or 50 μM Cu2+. (B) Dot blot analysis of Aβ assembly (10 μM) in the presence or absence of both copper and CQ at 1:1 and 5:1 molar ratios. A11 monitors oligomeric Aβ conformations and 6E10 monitors total Aβ. (C) Dot blot (Left) and quantitation (Right) of Aβ assembly reactions in the presence of indicated concentrations of copper and CQ.

