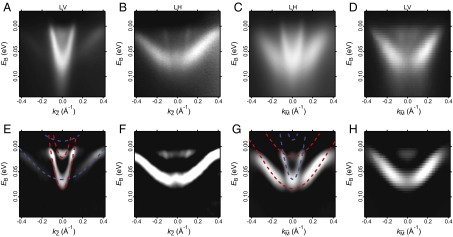
Fig. 3.

ARPES of the electronic structure at SrTiO3(110)-(4 × 1). (A–D) Energy-momentum intensity maps ( ,
,  ) along the
  (or [001]) direction and the
  (or
(or  ) direction, respectively. (E–H) Corresponding second derivatives. In each direction, the spectra were measured with linear vertical (A and D) and linear horizontal (B and C) polarized light. Tight-binding fits are overlaid for both directions. The
  -like bands are drawn in blue and the
  -like bands in red. The
  -derived bands are weakly dispersive and
  -derived bands are strongly dispersive along [001]; the
  -derived bands become weakly dispersive and
  -derived band becomes strongly dispersive along
  . The subbands become more visible in E–H.
