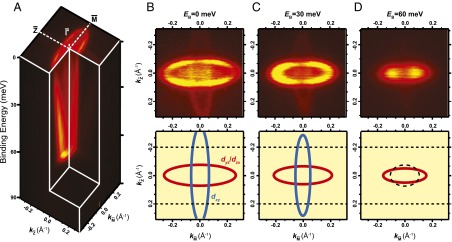
Fig. 4.

Overview of the electronic structure. (A) Full photoemission mapping and (B–D) constant energy cuts at different binding energies (EB = 0, 30, and 60 meV) and schematic constant-energy surfaces (Lower). Data taken with LV light, which emphasizes  and
and  orbitals. These appear bright, whereas
  -derived states appear faint. In the schematics the reconstructed (4 × 1) Brillouin zone is indicated by dotted lines. Note that the Fermi surface lies in the (1 × 1) Brillouin zone, consistent with the 2DEG being confined at the SrTiO3 layers beneath the surface reconstruction. At higher binding energy, EB = 60 meV, only the
  -derived ellipsoid is occupied. The resulting constant-energy surface is strongly anisotropic compared with the bulk projected energy surface (black dashed ellipsoid).
