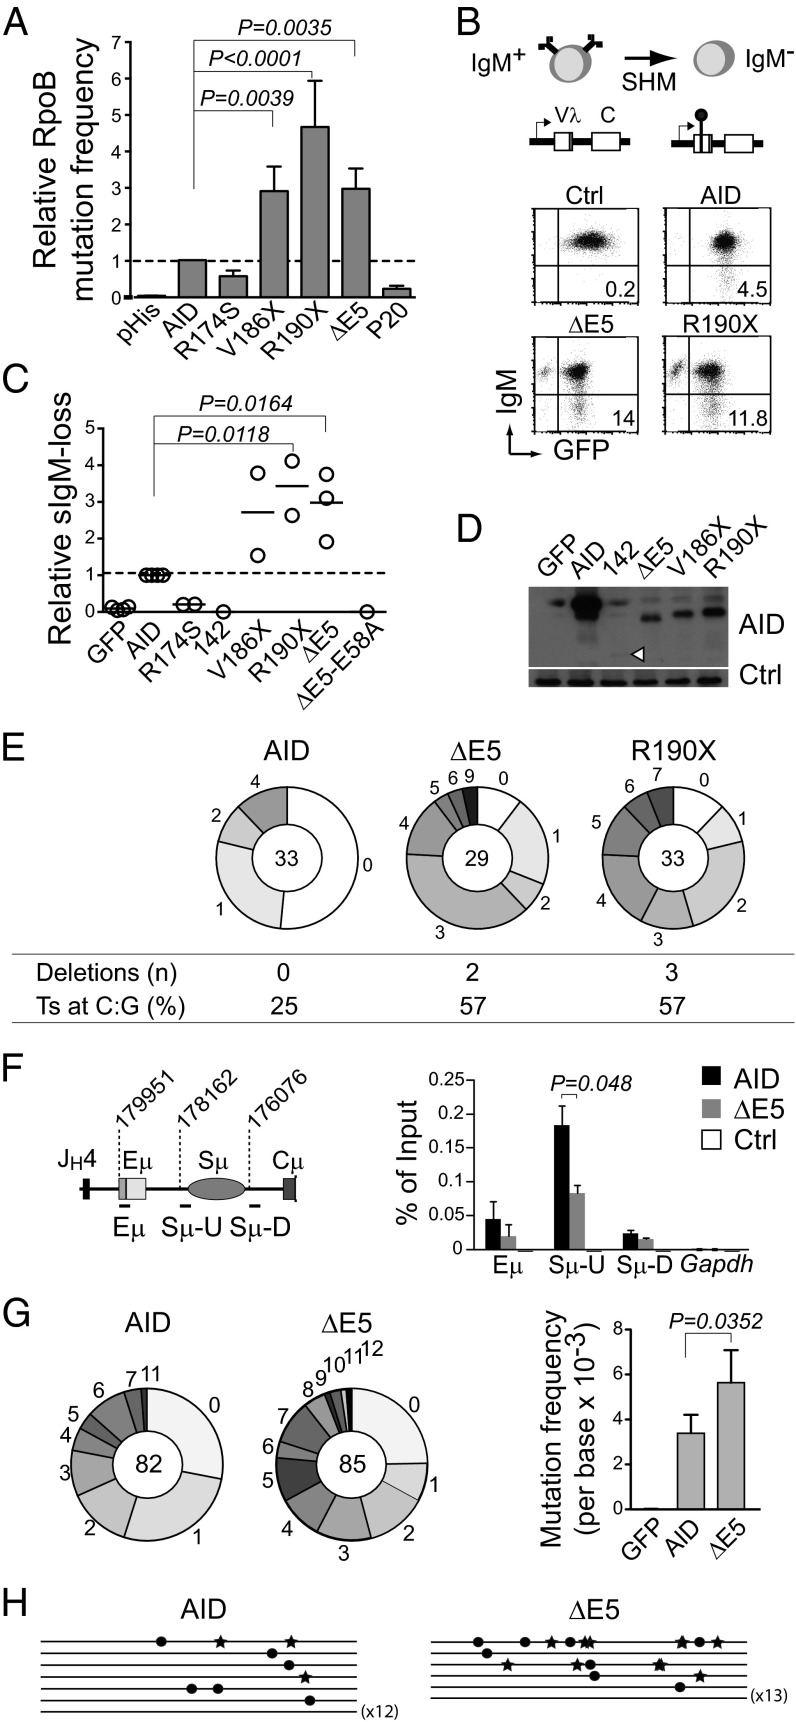
Fig. 2.
CSR-deficient and dominant-negative AID variants are hypermutagenic. (A) Relative rpoB mutation frequency of AID variants in E. coli. Means + SDs of the relative medians obtained from three independent experiments normalized to AID are shown. Significant P values by ANOVA with the Holm–Sidak posttest are indicated. P20 and R174S are significantly less active than AID by t test (pHis vs. R174S, P = 0.0002; AID vs. R174S, P = 0.0002; pHis vs. P20, P = 0.0032; AID vs. P20, P < 0.0001). (B) Diagram and representative flow cytometry plots of the surface IgM-loss assay for estimating SHM frequency in IgM+ DT40 ΔψVL Aicda−/− B cells complemented with AID or variant-ires-GFP. (C) Relative IgM-loss capacity of AID variants. Each symbol is the median of ≥12 cultures from one to three experiments performed per variant normalized to their AID control median value. Horizontal lines are means. Statistics are the same as in A. (D) Western blot of AID variants in DT40 B cells. A nonspecific band was used as loading control (Ctrl). (E) Mutation load of the DT40 IgVλ in complemented cells. Pie chart slices represent the proportion of sequences with the indicated number of mutations, with the total number of sequences analyzed at the center. Deletion events and the proportion of transition (Ts) mutations at C:G pairs are indicated. (F) Real-time PCR ChIP analysis of UNG occupancy at the Igh or Gapdh control in mouse Aicda−/− B cells transduced with pMXs empty (Ctrl), AID, or ΔE5-ires-GFP vectors 21 h postinfection. The Igh amplicons and their first nucleotide position are shown on the scheme (according to the National Center for Biotechnology Information contig NG_005838.1). Means + SDs of three independent experiments are plotted. P value by t test. (G) Mutation load (pie charts; plotted as in E) of a 628-bp Sμ fragment (nucleotides 177959–178587 of NG_005838.1) in transduced Aicda−/− Ung−/− B cells. Bars show means + SDs mutation frequencies from four experiments. P value by t test. (H) Sγ1 region sequences from transduced Aicda−/− Ung−/− mouse B cells (1,805-bp fragment, nucleotides 90156–91960 of NG_005838.1). Each line is a sequence, with mutations at G indicated by stars and mutations at C indicated by dots.

