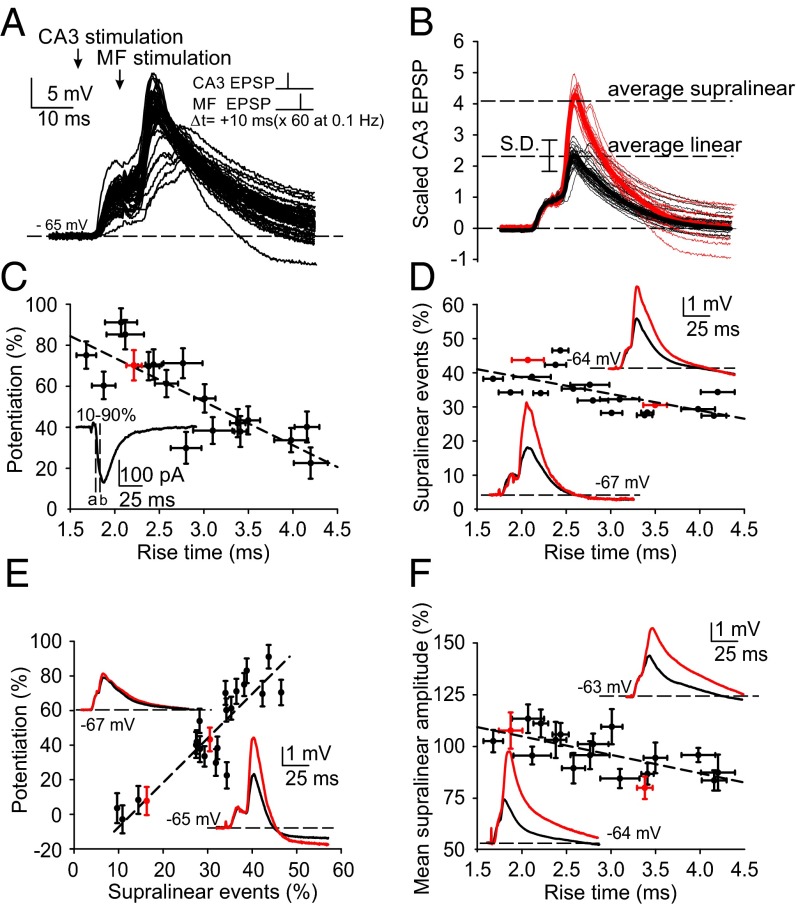
Fig. 3.
Supralinear responses induced by pairing subthreshold CA3 recurrent and mossy fiber EPSPs. (A) Both linear and supralinear responses were induced during pairing of evoked EPSPs. (B) Illustration of the criterion used to distinguish between linear and supralinear summation of CA3 recurrent and mossy fiber evoked responses. Traces are scaled to the amplitude of the evoked CA3 recurrent EPSP, thereby revealing two discrete populations of responses. (C) A correlation is revealed when plotting the EPSC rise time, as a reflection of the distance between juxtasomatic mossy fiber input and more distal CA3 synaptic input, and the magnitude of LTP, suggesting that the proximity of CA3 input to mossy fiber input is critical for LTP induction. (Inset) Rise time measured from 10% of minimum (a) to 90% of maximum (b) of the EPSC evoked at −70 mV by stimulation of the CA3 recurrent input. The red data point corresponds to traces in the Inset. (D) EPSC rise time correlates with the probability of generating a supralinear response. (Inset) Averaged linear and supralinear responses. (E) The number of supralinear events evoked during the 60 pairings expressed in percent correlates with the magnitude of LTP, implicating the supralinear event as a causative factor. (F) EPSC rise time also correlates with the mean amplitude of the supralinear response.

