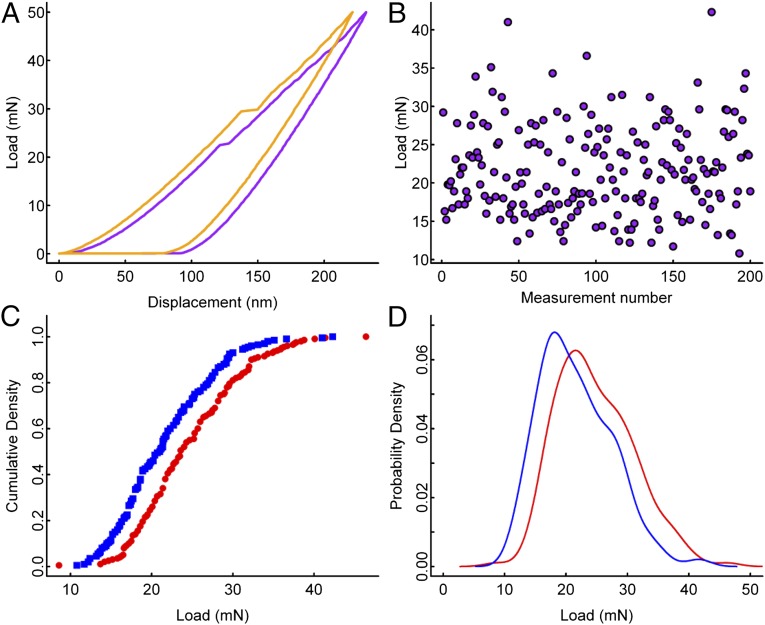
Fig. 2.
Statistical analysis of the first pop-ins. (A) Two load-displacement traces from nanoindentation tests demonstrating the range of pop-in values under the same conditions (displacement of the solid curve has been offset by 10 nm for ease of viewing). (B) The observed data show no systematic drift over the course of experimentation. (C) Cumulative density and (D) probability density for as-cast (blue) and relaxed (red) Fe-BMG samples.

