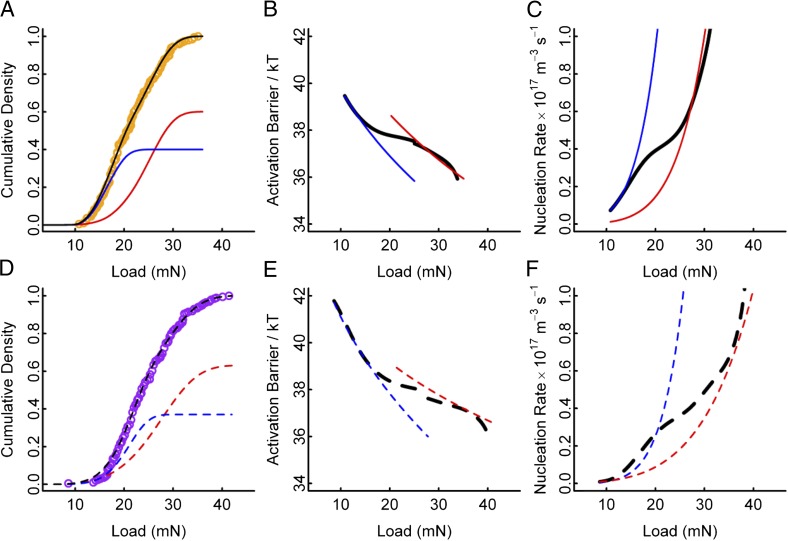
Fig. 4.
Activation energy barrier and nucleation rates of the first pop-ins in the Fe-BMG samples. (A–C) For the as-cast sample. (D–F) For the annealed sample. (A and D) The experimental cumulative density function is displayed together with the separate calculated contributions from each of the two nucleation sites. There is a close agreement between the fitted cumulative distribution and the measurements over the entire range including the endpoints. (B and E) The trend of activation barrier and the resultant nucleation rates as a function of load are separated and indicate the existence of two nucleation sites with an overlapping load range of operation. In the low load range where the nucleation barrier ranges from 42kT to 36kT, the nucleation rate (C and F) reaches 0.4 × 10¹⁷ m−3⋅s−1 when a transition occurs to operation of the high load site.

