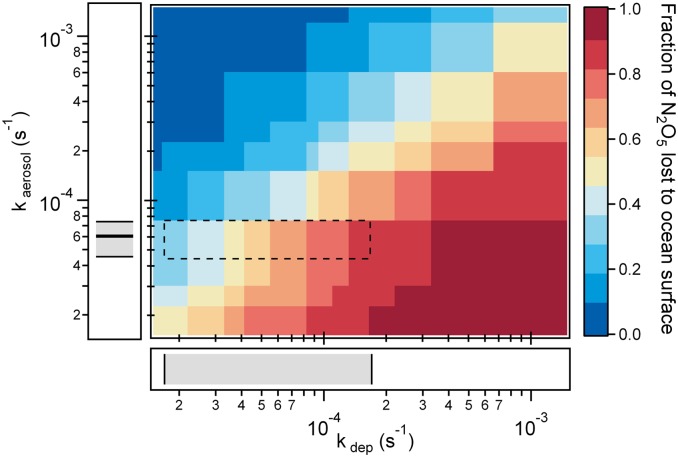
Fig. 4.
Fraction of the total N2O5 removal attributed to deposition to the ocean shown as a function of the N2O5 deposition rate (kdep) and the heterogeneous loss rate to aerosols (kaerosol). The boxed region represents the range in kdep and kaerosol measured at the SIO pier in La Jolla, CA. The median and interquartile range in the observed kaerosol is shown on the ordinate, while the range in the observed kdep [based on a marine boundary layer inversion height (zi) of 100–1000 m, at an average wind speed of 9.1 ± 1.3 m s−1] is shown on the abscissa.

