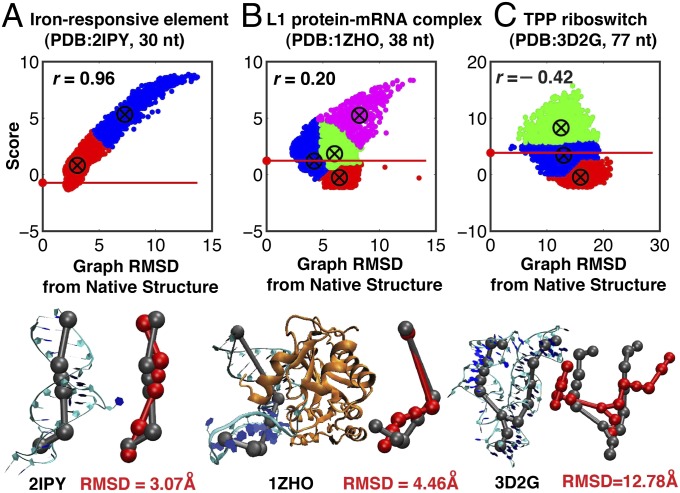
Fig. 4.
Clustered energy landscape and correlation between score and graph rmsd from native structure for three cases. (A) Typical positive correlation (2IPY, r = 0.96, also for 1OOA, 2IPY, 1MJI, 1I6U, 1F1T, 1S03, 1XJR, 2PXB, 2OIU, 1MZP, 2HGH, 1DK1, 1D4R, 1KXK, 1P5O, and 1MFQ). (B) Neutral correlation (1ZHO, r = 0.20, also for 1RLG, 2OZB, 2HW8, 1ZHO, 1U63, 1SJ4, 2LKR, and 1GID). (C) Negative correlation (3D2G, r = –0.42, also for 1MMS, 3D2G, 2HOJ, 2GDI, and 2GIS). Red horizontal lines mark scores of the native structure. (Lower) Representative graphs (red) from clusters with native-like scores are superimposed upon solved structures (gray).

