
Table 1.
Graph results for 30 test RNAs
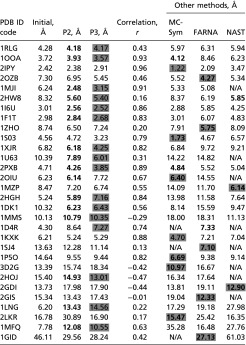 |
Shown are rmsds between reference graphs from solved structures and our sampled graphs by MC/SA—initial, lowest score (P2, restricted moves) and lowest cluster representative (P3, random moves) after MC/SA—along with correlation coefficients between rmsd and score (r). Compared with predictions by MC-Sym (2), FARNA (3), and NAST (1), best rmsds for our P2 are shown in bold, and our P3 in gray highlight. See SI Appendix, Table S2 for other assessment protocols (N/A, program fails).