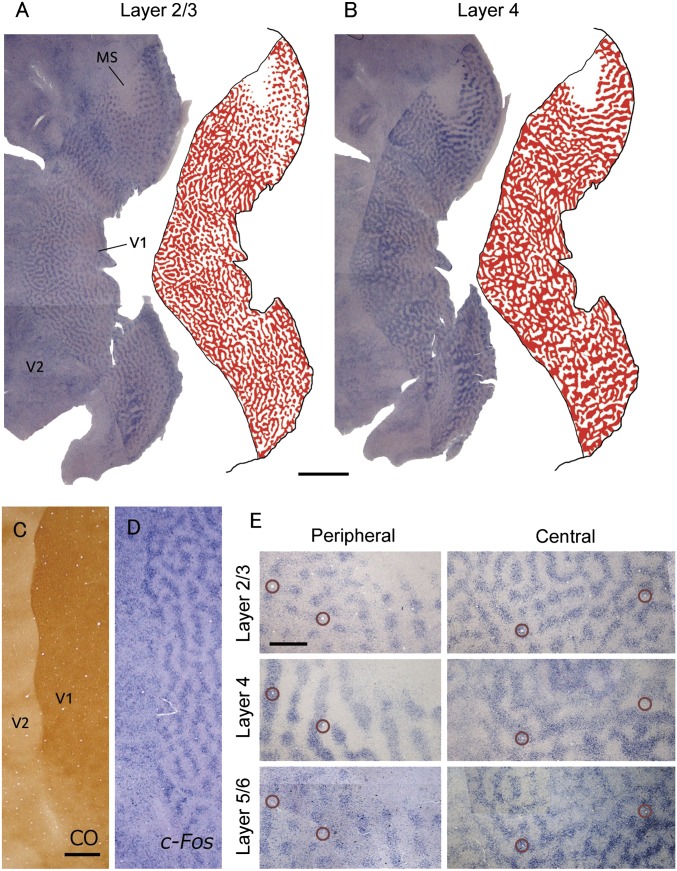
Fig. 1.
An owl monkey case (ID 11-04) subjected to MI in the left eye for 24 h. An ODC-like pattern was revealed by IEG expression throughout V1 except in the presumptive MS. (A and B) Tangential sections of whole flattened V1 contralateral to the inactivated eye reacted for c-Fos mRNA (A) 640 μm from the pial surface, mostly in layer 3, and (B) 880 μm from the pial surface, mostly in layer 4 (4C). ODC-like patterns in layer 2/3 (A) and layer 4 (4C) (B) were illustrated by red on the right side of the sections. (Scale bar, 5 mm.) (C and D) Higher magnification of the adjacent tangential sections stained for CO activity (C, 720 μm from the pial surface) and c-Fos mRNA (D, 640 μm) around the V1/V2 border. (Scale bar, 1 mm.) (E) Flattened sections stained for c-Fos mRNA, showing differences in ODC-like patterns across layers and V1 regions. Circles indicate the same radial blood vessels across layers. Depths are 640 μm (Top), 880 μm (Middle), and merge of 1,120 μm and 1,240 μm (Bottom) of peripheral V1, respectively, and 640 μm (Top), merge of 760 μm and 880 μm (Middle), and merge of 1,000 μm and 1,040 μm (Bottom) of central V1. (Scale bar, 1 mm.)

