Fig. 3.
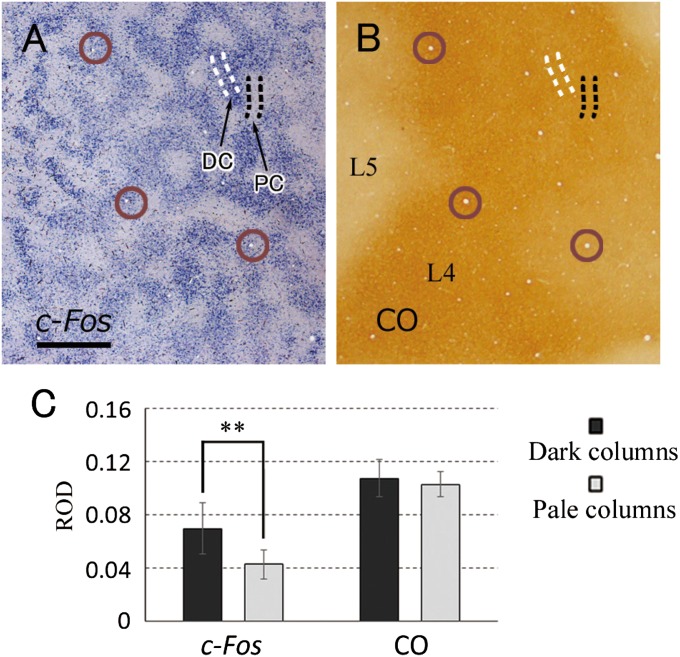
Comparison between IEG mRNA expression and CO staining patterns. (A and B) The tangential cortical sections of V1 from the monkey subjected to 24-h MI (ID 11-04), stained for c-Fos mRNA (A) or CO activity (B). The depth from the pial surface is 1,000 μm and 960 μm, respectively, representing mostly layer 4 (4C). The two images are aligned exactly at the same V1 portion, guided by the radial blood vessels (brown open circles). L4/layer 4, L5/layer 5. (Scale bar, 1 mm.) (C) Quantification of signal intensity of ISH for c-Fos and CO activity. ROIs were taken for DCs and PCs from the ISH image as illustrated by white and black dotted lines in A, respectively, and also applied to the CO staining image. RODs of PC were significantly lower than those of DC in ISH images (**P < 0.01, paired Student t test, six sections), whereas they were not in CO staining images (P = 0.19).

