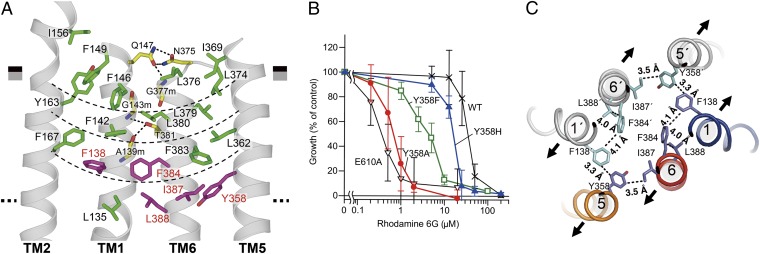
Fig. 3.
Extracellular gate. (A) Close-up view of the four-layered cluster. The boundaries of the four-layered cluster are indicated as thin dashed lines. Residues whose replacement markedly decreased transport activity in the drug-susceptibility assay using rhodamine 6G are colored in purple. Hydrogen bonds are indicated as thick dashed lines. (B) Rhodamine 6G susceptibility of yeast cells expressing CmABCB1 mutants. Yeast cells expressing WT CmABCB1 or mutant proteins were cultured with various concentrations of rhodamine 6G. E610A is an ATPase-deficient mutant (SI Materials and Methods). Cell proliferation was analyzed by measuring the absorbance at 600 nm, and growth (% of control) was plotted against rhodamine 6G concentration. Data are means ± SD (n = 11–32). (C) Key interacting residues at the extracellular gate, viewed from the extracellular side. Contacts within van der Waals and/or hydrophobic interactions are indicated with dashed lines. The expected directions of the initial stages of TM helix motions from the inward-open to outward-open states are indicated as arrows.

