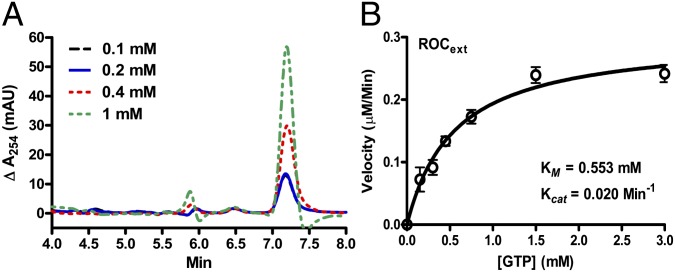
Fig. 4.
GTPase activity of Rocext. (A) Background-subtracted LC/MS spectra of GDP generated by Rocext GTP hydrolysis activity. Reaction was conducted with a range of GTP concentrations (0.1–1 mM). This graph shows proportional production of GDP with respect to the concentration of GTP. (B) Steady-state kinetics of Rocext GTP hydrolysis. Data (open circles) is an average of three independent measurements with error bars (± SEM) indicated.

