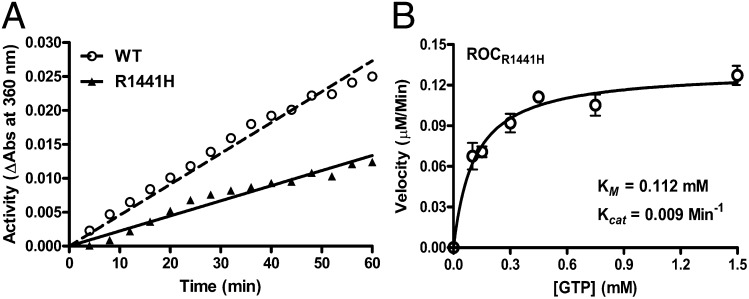
Fig. 7.
GTPase activity of RocR1441H. (A) Time course (1 h) GTPase activity assayed showing RocR1441H (filled triangle with solid line) is less active than RocWT (open circle with dashed line). (B) Steady-state kinetics of RocR1441H GTP hydrolysis confirming that RocR1441H has a lower activity than RocWT. Data (open circle) are averages of three independent measurements with error bars (SEM) indicated.

