
Fig. 6.
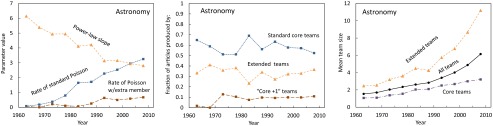
Trends in team evolution in astronomy from 1961 to 2010. (Left) Fifty-year trend of parameters characterizing the three components of the distribution, derived from a functional fit (Eq. 1). The characteristic size (i.e., Poisson rate) of standard core teams has  been rising throughout this period, whereas that of “core +1” teams
  has remained constant in the last two decades. The power-law slope
  has been getting shallower, i.e., the significance of the power-law component has been increasing. (Center) Fraction of articles produced by different modes of authorship (team types): standard core
  , “core +1”
  , and extended
  . (Right) Trends in the mean team size, overall
  and by team type (both types of core teams,
  , and extended teams,
  ). The increase in the overall mean team size in astronomy is primarily the result of the rapid growth of power-law (extended) teams.