
Figure 2.
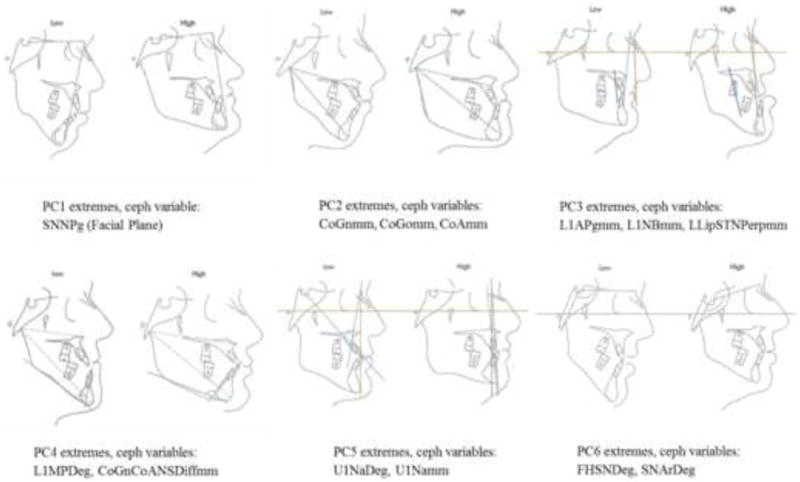
Ceph profiles of individuals with PC scores that fall on opposite ends (i.e. the most positive and most negative scores) on each of the six principal components together with the highest loading ceph variables within each component. PC 1 refers to the antero-posterior position of the mandible in relationship to the cranial base and explains 23.7% of the variation. PC 2 refers to the maxillo-mandibular horizontal and vertical size discrepancies and explains 17.3% of the variation. PC 3 refers to the position and inclination of the lower incisor and its effect on lower lip protrusion and explains 13.3% of the variation. PC 4 refers to lower incisor angulation, facial taper and variation in maxillo-mandibular discrepancies and explains 12.0% of the variation. PC 5 refers to variation in the upper incisor and the maxillary horizontal position and explains 8.3% of the variation. PC 6 refers to variation in the cranial base and explains 6.7% of the variation.