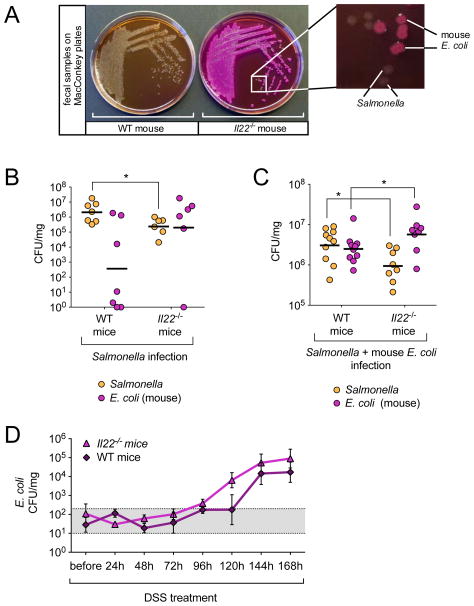
Figure 4. Competition of S. Typhimurium with E. coli.
(A) Colon content samples collected from WT and Il22−/− mice at 96h post infection were resuspended in PBS and streaked on MacConkey agar plates for single colonies. Magnification shows the presence of lactose fermenting (pink) and lactose non-fermenting colonies in a sample from an Il22−/− mouse. (B+C) WT and Il22−/− mice were either (B) infected with S. Typhimurium (WT n=7, Il22−/− n=6) or (C) infected with S. Typhimurium and 24h later given 109 CFUs of mouse E. coli strain JB2 (WT n=10, Il22−/− n=8). Four days after infection with S. Typhimurium, colon content samples were collected and MacConkey plates were used to enumerate lactose fermenting (E. coli) and non lactose-fermenting (S. Typhimurium) colonies. Horizontal lines represent the geometric mean. (D) Fecal samples were collected from WT and Il22−/− mice before and every 24h after mice were given DSS in water. Samples were resuspended in PBS and plated on MacConkey agar plates to enumerate CFUs of E. coli (WT n=4, Il22−/− n=4). Gray area (101 to 3×10²) indicates basal E. coli level in mice (See also Fig. S4).

