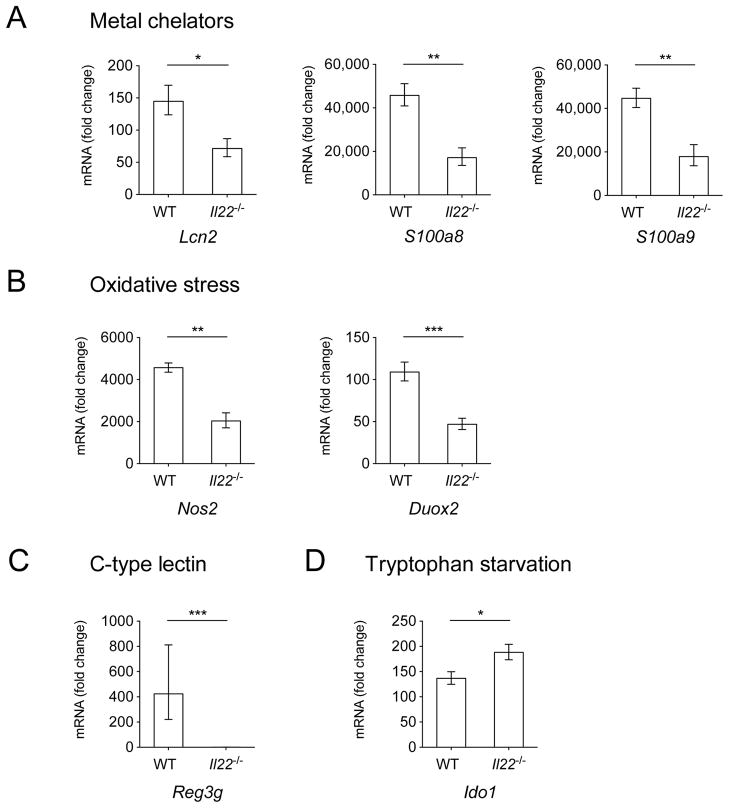
Figure 5. Expression of antimicrobial peptide genes.
(A) Lcn2, S100a8, S100a9, (B) Duox2, Nos2, (C) Reg3g, and (D) Ido1 were detected by quantitative real time PCR in the cecum of WT mice and Il22−/− mice 72h after infection with WT S. Typhimurium. Infected WT n=6, infected Il22−/− n=6, mock n=4. Data are expressed as fold increase over mock-infected WT mice. Data represent the geometric mean ± standard error. A significant increase over mock control is indicated by * (P value ≤ 0.05), ** (P value ≤ 0.01) and *** (P value ≤ 0.001). (See also Fig. S5).

